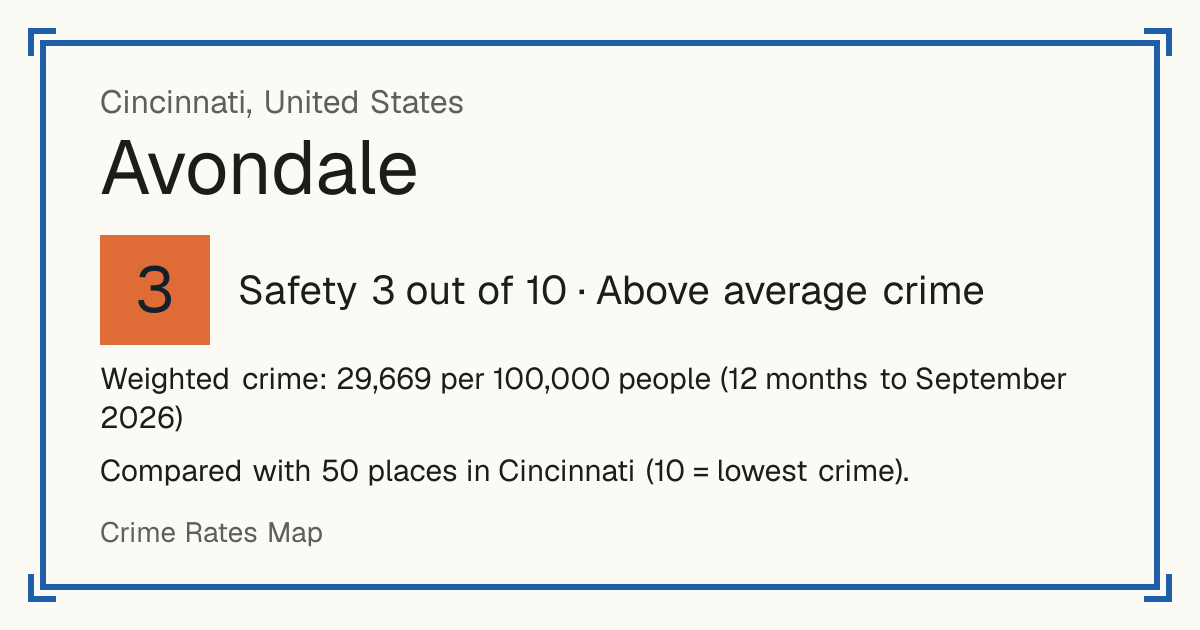
3Avondale
Avondale, Cincinnati, United States: crime rate and Safety score
Safety 3 out of 10 Above average crime
3/10 in Cincinnati · 2/10 in the world
Compared with 50 places in Cincinnati (10 = lowest crime).
Weighted crime: 29,652 per 100,000 people (12 months to September 2026)
Residents: 11,345
How accurate: in 2026-09, 84% of the 50 neighbourhoods compared scored within 1 of their 2025-09 score.
Crime by type, as recorded by Cincinnati Police Department (12 months to September 2026)
| Type | Count | Per 100,000 a year | All places this source covers |
|---|---|---|---|
| Homicide | |||
| Homicide | 5 | 44.1 | 16.8 |
| Sexual offences | |||
| Rape | 19 | 167.5 | 77.3 |
| Violence | |||
| Aggravated assault | 83 | 731.6 | 241.3 |
| Cincinnati police publish simple assaults only inside a bucket of minor offences with no breakdown, so they are not counted here. | |||
| Strangulation | 32 | 282.1 | 130.7 |
| Robbery | |||
| Robbery | 47 | 414.3 | 181.5 |
| Theft and burglary | |||
| Burglary | 100 | 881.4 | 471 |
| Personal and other theft | 193 | 1,701.2 | 1,583.7 |
| Theft from a vehicle | 86 | 758 | 985.9 |
| Motor vehicle theft | 100 | 881.4 | 573.2 |
Source: Cincinnati Police Department, updated 26 October 2026.
Recorded crime by type (12 months to September 2026)
| Homicide | 5 |
|---|---|
| Sexual offences | 19 |
| Violence | 115 |
| Robbery | 47 |
| Theft and burglary | 479 |