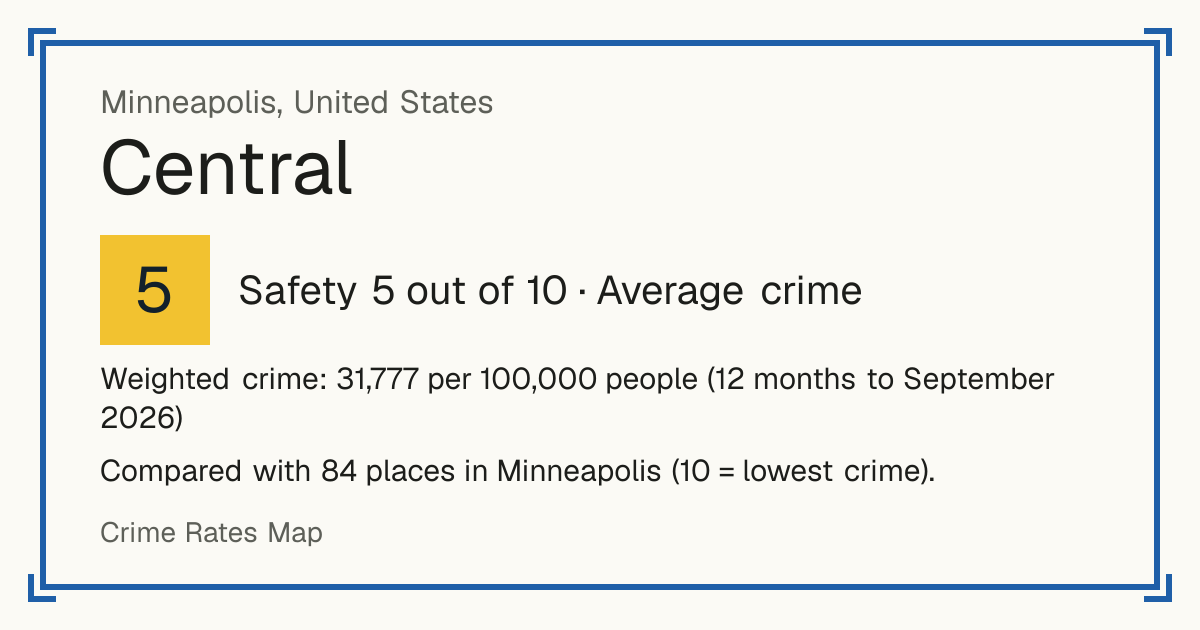
5Central
Central, United States: crime rate and Safety score
Safety 5 out of 10 Average crime
5/10 in Minneapolis · 3/10 in the world
Compared with 84 places in Minneapolis (10 = lowest crime). 2 places were left out of the comparison (incomplete figures or very few residents).
Weighted crime: 31,777 per 100,000 people (12 months to September 2026)
Residents: 8,226
How accurate: in 2026-09, 93% of the 84 neighbourhoods compared scored within 1 of their 2025-09 score.
Crime by type, as recorded by Minneapolis Police Department (12 months to September 2026)
| Type | Count | Per 100,000 a year | All places this source covers |
|---|---|---|---|
| Homicide | |||
| Murder and non-negligent manslaughter | 0 | 0 | 10.5 |
| Sexual offences | |||
| Sexual offences | 19 | 231 | 172.1 |
| Violence | |||
| Aggravated assault | 49 | 595.7 | 561 |
| Simple assault | 71 | 863.1 | 1,004.5 |
| Robbery | |||
| Robbery | 24 | 291.8 | 210 |
| Theft and burglary | |||
| Burglary | 44 | 534.9 | 574.7 |
| Theft from a vehicle | 54 | 656.5 | 994.1 |
| Theft of vehicle parts | 31 | 376.9 | 289.1 |
| Motor vehicle theft | 143 | 1,738.4 | 1,232.7 |
| Shoplifting | 0 | 0 | 243 |
| Theft from a building | 5 | 60.8 | 48.4 |
| Other theft | 64 | 778 | 1,375 |
| Drugs | |||
| Drug offences | 10 | 121.6 | 263.3 |
| Damage and public order | |||
| Vandalism and property damage | 140 | 1,701.9 | 1,870 |
| Like every row here: offences recorded by Minneapolis Police (NIBRS), in the neighbourhood the city gives each one, by report date. | |||
Source: Minneapolis Police Department, updated 26 October 2026.
Recorded crime by type (12 months to September 2026)
| Homicide | 0 |
|---|---|
| Sexual offences | 19 |
| Violence | 120 |
| Robbery | 24 |
| Theft and burglary | 341 |
| Drugs | 10 |
| Damage and public order | 140 |