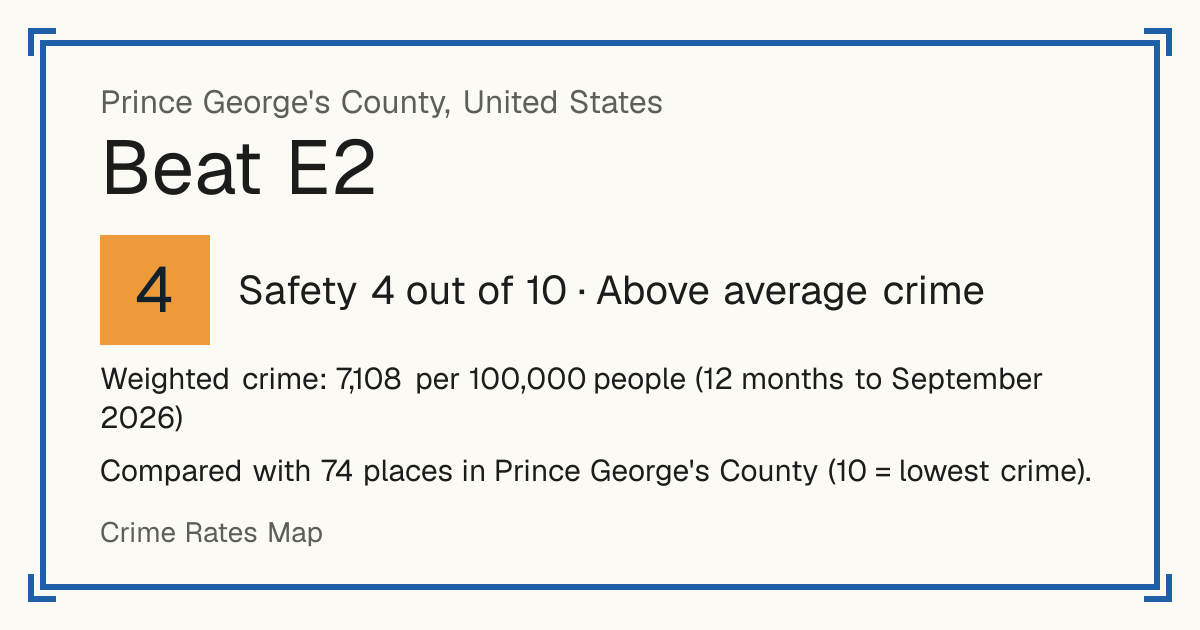
4Beat E2
Beat E2, United States: crime rate and Safety score
Safety 4 out of 10 Above average crime
4/10 in Prince George's County · 2/10 in the world
Compared with 74 places in Prince George's County (10 = lowest crime).
Weighted crime: 7,108 per 100,000 people (12 months to September 2026)
Residents: 18,825
How accurate: in 2026-09, 86% of the 74 neighbourhoods compared scored within 1 of their 2025-09 score.
Crime by type, as recorded by Prince George's County Police Department (12 months to September 2026)
| Type | Count | Per 100,000 a year | All places this source covers |
|---|---|---|---|
| Homicide | |||
| Homicide | 0 | 0 | 2.5 |
| Sexual offences | |||
| Sex offences | 19 | 100.9 | 21.9 |
| Violence | |||
| Assault | 15 | 79.7 | 93.2 |
| Assault with a dangerous weapon | 1 | 5.3 | 10.1 |
| Shootings (assault with a firearm) | 6 | 31.9 | 15.9 |
| Robbery | |||
| Robbery of a person | 6 | 31.9 | 31.2 |
| Robbery of a business | 0 | 0 | 5.5 |
| Robbery in a home | 0 | 0 | 1.7 |
| Carjacking | 2 | 10.6 | 7.7 |
| Theft and burglary | |||
| Burglary of a home | 3 | 15.9 | 36.8 |
| Burglary of a business | 4 | 21.2 | 33.2 |
| Burglary of other buildings | 0 | 0 | 6.3 |
| Theft | 81 | 430.3 | 477.1 |
| Theft from a vehicle | 151 | 802.1 | 441.9 |
| Motor vehicle theft | 92 | 488.7 | 367.5 |
| Motor vehicle theft (vehicle recovered) | 6 | 31.9 | 41 |
Source: Prince George's County Police Department, updated 29 October 2026.
Recorded crime by type (12 months to September 2026)
| Homicide | 0 |
|---|---|
| Sexual offences | 19 |
| Violence | 22 |
| Robbery | 8 |
| Theft and burglary | 337 |
Questions about crime in Beat E2
- Is Beat E2 safe?
- Beat E2: Safety 4 out of 10 (Above average crime). Compared with 74 places in Prince George's County (10 = lowest crime).
- What is the crime rate in Beat E2?
- Beat E2: Weighted crime: 7,108 per 100,000 people (12 months to September 2026).
- How many murders are there in Beat E2?
- Recorded homicides in Beat E2 (12 months to September 2026): 0.