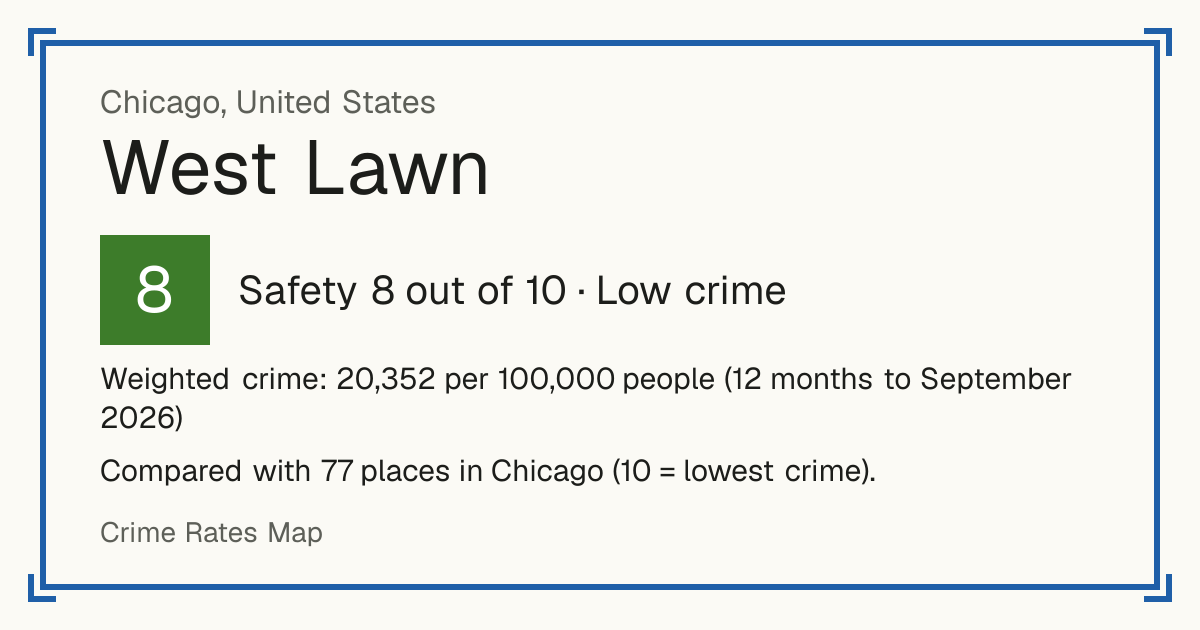
8West Lawn
West Lawn, United States: crime rate and Safety score
Safety 8 out of 10 Low crime
8/10 in Chicago · 3/10 in the world
Compared with 77 places in Chicago (10 = lowest crime).
Weighted crime: 20,352 per 100,000 people (12 months to September 2026)
Residents: 33,662
How accurate: in 2026-09, 100% of the 77 neighbourhoods compared scored within 1 of their 2025-09 score.
Crime by type, as recorded by City of Chicago (12 months to September 2026)
| Type | Count | Per 100,000 a year | All places this source covers |
|---|---|---|---|
| Homicide | |||
| Homicide | 3 | 8.9 | 15.6 |
| One per victim; includes involuntary manslaughter and reckless homicide. | |||
| Sexual offences | |||
| Criminal sexual assault | 8 | 23.8 | 60.3 |
| Illinois' offence that includes rape. | |||
| Other sex offences | 15 | 44.6 | 50.3 |
| Violence | |||
| Battery | 285 | 846.7 | 1,542.6 |
| In Illinois, battery is the attack itself (bodily harm or offensive contact). | |||
| Assault (threat of violence) | 135 | 401 | 761.5 |
| In Illinois, assault is putting someone in fear of an attack, without contact. | |||
| Robbery | |||
| Robbery | 28 | 83.2 | 176 |
| Theft and burglary | |||
| Burglary | 112 | 332.7 | 483.6 |
| Theft | 393 | 1,167.5 | 1,860.2 |
| Motor vehicle theft | 190 | 564.4 | 667.8 |
| Drugs | |||
| Drug offences | 9 | 26.7 | 237.1 |
| Damage and public order | |||
| Criminal damage | 183 | 543.6 | 938.4 |
| Criminal trespass | 53 | 157.4 | 201.9 |
| Public peace violation | 2 | 5.9 | 45.4 |
| Other | |||
| Weapons offences | 20 | 59.4 | 179.3 |
| Arson | 1 | 3 | 13.7 |
Source: City of Chicago, updated 28 October 2026.
Recorded crime by type (12 months to September 2026)
| Homicide | 3 |
|---|---|
| Sexual offences | 23 |
| Violence | 420 |
| Robbery | 28 |
| Theft and burglary | 695 |
| Drugs | 9 |
| Damage and public order | 238 |
| Other | 21 |
Questions about crime in West Lawn
- Is West Lawn safe?
- West Lawn: Safety 8 out of 10 (Low crime). Compared with 77 places in Chicago (10 = lowest crime).
- What is the crime rate in West Lawn?
- West Lawn: Weighted crime: 20,352 per 100,000 people (12 months to September 2026).
- How many murders are there in West Lawn?
- Recorded homicides in West Lawn (12 months to September 2026): 3.