Crime in West Bromwich
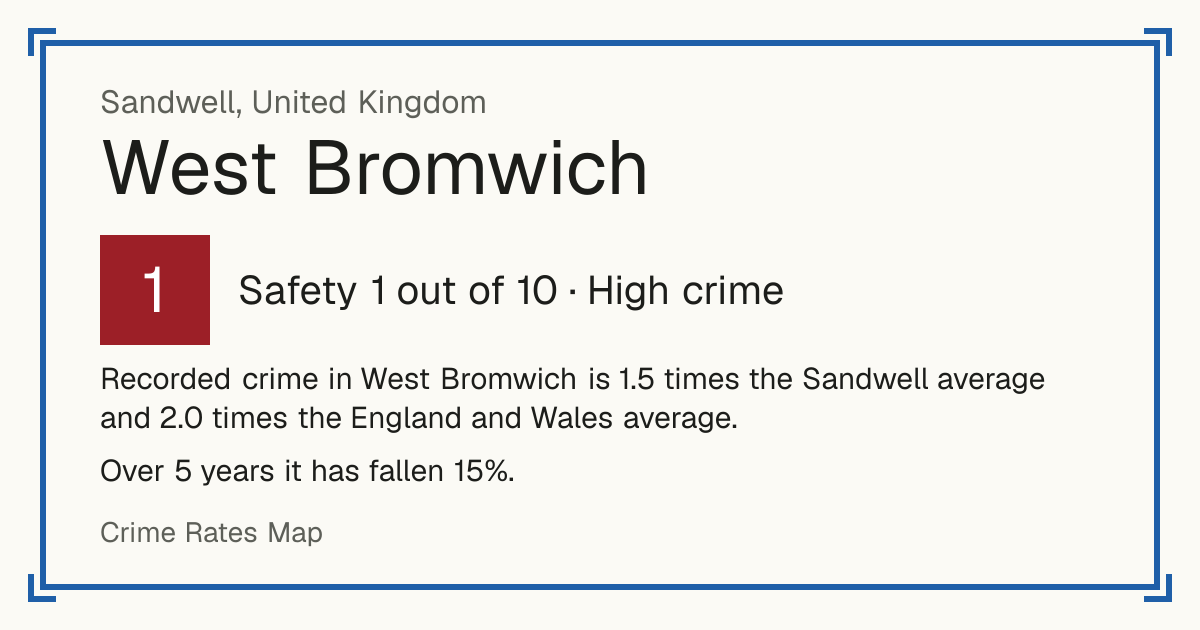
Recorded crime in West Bromwich is 1.5 times the Sandwell average and 2.0 times the England and Wales average. Over 5 years it has fallen 15%. Most of the harm comes from violence and sexual offences (assaults, harassment, sexual offences). Police data to August 2026.
Within 1.5 km of the centre of West Bromwich: about 33,345 residents in 24 neighbourhoods.
- Safety in the UK
- 1/10High crime
- Living
- 8.6/10Excellent
- 5-year change
- −15%fewer crimes
- vs the council
- 1.5×the Sandwell average
Neighbourhoods by Safety
Within 1.5 km of the centre of West Bromwich.
Crime over 5 years
Down 15% in 5 years Recorded crimes within 1.5 km of West Bromwich, anti-social behaviour left out.
What is recorded
Crime severity: 1.5× the Sandwell average (2.0× the England and Wales average). 143 recorded crimes per 1,000 residents a year.
- Violence and sexual offences (assaults, harassment, sexual offences): 58% of the harm here
- Robbery: 13% of the harm here
- Burglary: 13% of the harm here
Anti-social behaviour: 16 incidents per 1,000 residents a year, not scored. Not a crime, so it is not part of the Safety score.
Crimes recorded in Sandwell (the whole council area)
April 2025 to March 2026, for the whole Sandwell council area, not only West Bromwich. Source: Home Office, police recorded crime by community safety partnership.
| Type | Crimes in 2025/26 | Per 1,000 residents | Change on 2024/25 |
|---|---|---|---|
| Cars stolen | 1,619 | 4.6 | Up 3% |
| Cars broken into | 1,181 | 3.3 | Up 11% |
| Vandalism (homes, other buildings and vehicles) | 2,041 | 5.8 | Down 3% |
| Burglary of homes | 781 | 2.2 | Down 11% |
| Homicide (murder and manslaughter) | 5 | - | - |
Under 10 a year: no rate or change, the numbers are too small to compare.
How often crimes lead to a charge in B70
In B70, the postcode district at the centre of West Bromwich, 14% of crimes reported between September 2024 and August 2025 led to someone being charged or summonsed (England and Wales: 9%).
- Charged or summonsed
- Caution or other action
- Suspect found, not prosecuted
- No suspect identified
- Still open
Show as a table
| Type | Crimes | Charged or summonsed | Caution or other action | Suspect found, not prosecuted | No suspect identified | Still open |
|---|---|---|---|---|---|---|
| Violence and sexual offences (assaults, harassment, sexual offences) | 2,163 | 9% | 7% | 68% | 13% | 2% |
| Shoplifting | 700 | 27% | 9% | 22% | 41% | 0% |
| Criminal damage and arson (vandalism) | 428 | 13% | 6% | 37% | 43% | 1% |
| Vehicle crime (cars stolen and broken into) | 391 | 3% | 0% | 15% | 81% | 0% |
| Public order | 384 | 30% | 4% | 47% | 16% | 2% |
| Other theft | 375 | 3% | 2% | 29% | 64% | 2% |
| Drugs | 242 | 26% | 54% | 16% | 3% | 1% |
| Burglary | 241 | 8% | 0% | 28% | 62% | 1% |
| Robbery | 165 | 10% | 2% | 25% | 62% | 1% |
| Possession of weapons (knives and other weapons) | 134 | 36% | 6% | 40% | 17% | 1% |
| Other crime | 100 | 15% | 11% | 54% | 19% | 1% |
| Theft from the person (pickpocketing, bag snatching) | 72 | 1% | 0% | 28% | 65% | 6% |
Uses the latest outcome police have recorded so far. 1% of these crimes are still open, so the final figures may be a little higher.
Crime by type
Recorded crimes per 1,000 residents per year, most serious first, not counting anti-social behaviour.
| Type | Per 1,000 a year |
|---|---|
| Robbery | 3.9 |
| Burglary | 8.4 |
| Violence and sexual offences (assaults, harassment, sexual offences) | 58.8 |
| Drugs | 5.7 |
| Possession of weapons (knives and other weapons) | 2.6 |
| Other crime | 2.3 |
| Other theft | 11.0 |
| Theft from the person (pickpocketing, bag snatching) | 2.9 |
| Vehicle crime (cars stolen and broken into) | 11.9 |
| Criminal damage and arson (vandalism) | 11.7 |
| Public order | 12.2 |
| Bicycle theft | 1.1 |
| Shoplifting | 10.1 |
Postcode districts in West Bromwich
Nearby towns
Council: Sandwell
Questions about crime in West Bromwich
- Is West Bromwich a safe place to live?
- West Bromwich scores 1 out of 10 for safety (high crime), compared with every neighbourhood in England, Wales and Northern Ireland. Crime severity is 1.5 times the Sandwell average.
- Is crime going up or down in West Bromwich?
- Down 15% over 5 years, from 5,991 recorded crimes a year to 5,090.
- What is the most common crime in West Bromwich?
- The most common recorded crime is violence and sexual offences (assaults, harassment, sexual offences), about 59 per 1,000 residents a year.
- How does crime in West Bromwich compare with Sandwell?
- Crime severity in West Bromwich is 1.5 times the Sandwell average.
- How often does crime lead to a charge in West Bromwich?
- In B70, the postcode district at the centre of West Bromwich, 14% of crimes reported between September 2024 and August 2025 led to someone being charged or summonsed (England and Wales: 9%). 32% were closed without a suspect being identified.
- How many burglaries are solved in West Bromwich?
- Of 241 burglaries reported in B70, the postcode district at the centre of West Bromwich between September 2024 and August 2025, 8% led to someone being charged or summonsed and 62% were closed with no suspect identified.
- How many cars are stolen in West Bromwich?
- In Sandwell, the council area West Bromwich is in, the police recorded 1,619 cars stolen in 2025/26 (April 2025 to March 2026), 4.6 per 1,000 residents, up 3% on the year before.
- Is vandalism common in West Bromwich?
- 2,041 acts of vandalism to homes, other buildings and vehicles were recorded in 2025/26, in Sandwell, the council area West Bromwich is in, 5.8 per 1,000 residents, 1.2 times the England and Wales average.
- How many murders were there in West Bromwich last year?
- 5 homicides (murder or manslaughter) were recorded in 2025/26, in Sandwell, the council area West Bromwich is in, against 5 the year before. Police data does not say where in the area they happened.