Crime Rates Map

Rate Crime Rates Map

How useful is the site?

Sent by email to the person who runs the site. Please leave out personal details.

DunmurryTown

Crime in Dunmurry

Recorded crime in Dunmurry is 0.5 times the Belfast average and 0.6 times the England and Wales average. Over 5 years it has fallen 4%. Most of the harm comes from violence and sexual offences (assaults, harassment, sexual offences). Police data to August 2026.

Within 1.5 km of the centre of Dunmurry: about 18,004 residents in 53 neighbourhoods.

Safety in the UK
7/10Low crime
Living
8.0/10Good
5-year change
−4%fewer crimes
vs the council
0.5×the Belfast average

Neighbourhoods by Safety

Collin_J4: Safety 3 out of 10, above average crimeCollin_H4: Safety 9 out of 10, very low crimeCollin_R1: Safety 8 out of 10, low crimeCollin_J3: Safety 4 out of 10, above average crimeCollin_R2: Safety 4 out of 10, above average crimeCollin_P3: Safety 6 out of 10, average crimeCollin_H2: Safety 9 out of 10, very low crimeCollin_R3: Safety 8 out of 10, low crimeCollin_P1: Safety 5 out of 10, average crimeCollin_R4: Safety 9 out of 10, very low crimeBalmoral_N4: Safety 10 out of 10, very low crimeCollin_R5: Safety 10 out of 10, very low crimeLisburn_North_A1: Safety 1 out of 10, high crimeBalmoral_H4: Safety 5 out of 10, average crimeLisburn_North_C3: Safety 5 out of 10, average crimeCollin_H3: Safety 8 out of 10, low crimeCollin_J2: Safety 10 out of 10, very low crimeCollin_H1: Safety 9 out of 10, very low crimeLisburn_North_D1: Safety 6 out of 10, average crimeCollin_K3: Safety 1 out of 10, high crimeCollin_P2: Safety 2 out of 10, high crimeLisburn_North_A2: Safety 6 out of 10, average crimeLisburn_North_C1: Safety 9 out of 10, very low crimeCollin_P5: Safety 6 out of 10, average crimeLisburn_North_C2: Safety 9 out of 10, very low crimeBalmoral_D4: Safety 10 out of 10, very low crimeCollin_J1: Safety 9 out of 10, very low crimeBalmoral_N1: Safety 10 out of 10, very low crimeCollin_P6: Safety 5 out of 10, average crimeBalmoral_H3: Safety 10 out of 10, very low crimeBalmoral_H2: Safety 10 out of 10, very low crimeCollin_K1: Safety 6 out of 10, average crimeCollin_F3: Safety 7 out of 10, low crimeCollin_K2: Safety 1 out of 10, high crimeCollin_P4: Safety 6 out of 10, average crimeDownshire_East_A1: Safety 9 out of 10, very low crimeBalmoral_N2: Safety 10 out of 10, very low crimeLisburn_North_A3: Safety 7 out of 10, low crimeCollin_K4: Safety 4 out of 10, above average crimeBalmoral_L3: Safety 10 out of 10, very low crimeCollin_D4: Safety 10 out of 10, very low crimeLisburn_North_C5: Safety 8 out of 10, low crimeBalmoral_H1: Safety 8 out of 10, low crimeCollin_D3: Safety 5 out of 10, average crimeLisburn_North_D3: Safety 9 out of 10, very low crimeCollin_Q2: Safety 7 out of 10, low crimeBalmoral_N3: Safety 10 out of 10, very low crimeCollin_Q4: Safety 5 out of 10, average crimeLisburn_North_C4: Safety 9 out of 10, very low crimeCollin_C3: Safety 4 out of 10, above average crimeBalmoral_D1: Safety 10 out of 10, very low crimeBalmoral_G2: Safety 6 out of 10, average crimeCollin_G4: Safety 3 out of 10, above average crime
1 = least safe, 10 = safest. Grey: no score. Select a neighbourhood to open it on the map.

Within 1.5 km of the centre of Dunmurry.

Crime over 5 years

Down 4% in 5 years Recorded crimes within 1.5 km of Dunmurry, anti-social behaviour left out.

Sep 2021 – Aug 2022: 908 crimesSep 2021 – Aug 2022908Sep 2022 – Aug 2023: 985 crimesSep 2022 – Aug 2023985Sep 2023 – Aug 2024: 805 crimesSep 2023 – Aug 2024805Sep 2024 – Aug 2025: 842 crimesSep 2024 – Aug 2025842Sep 2025 – Aug 2026: 873 crimesSep 2025 – Aug 2026873

What is recorded

Crime severity: 0.5× the Belfast average (0.6× the England and Wales average). 46 recorded crimes per 1,000 residents a year.

  • Violence and sexual offences (assaults, harassment, sexual offences): 63% of the harm here
  • Burglary: 13% of the harm here
  • Drugs: 7% of the harm here

"Violence and sexual offences" is 63% of the harm here. It is a broad police category: most of these crimes are assaults without injury, harassment and threats, often indoors between people who know each other, and only a small part are sexual or serious violent offences. Police data does not say which, so each one is weighted at the England and Wales average for the category, which can overstate a quiet residential area.

Anti-social behaviour: 31 incidents per 1,000 residents a year, not scored. Not a crime, so it is not part of the Safety score.

Crime by type

Recorded crimes per 1,000 residents per year, most serious first, not counting anti-social behaviour.

TypePer 1,000 a year
Robbery0.2
Burglary2.7
Violence and sexual offences (assaults, harassment, sexual offences)20.0
Drugs3.2
Possession of weapons (knives and other weapons)0.6
Other crime1.3
Other theft6.3
Theft from the person (pickpocketing, bag snatching)0.1
Vehicle crime (cars stolen and broken into)1.9
Criminal damage and arson (vandalism)8.3
Public order0.5
Bicycle theft0.3
Shoplifting0.9

Postcode districts in Dunmurry

Nearby towns

Council: Belfast

Monthly report: Belfast crime figures for August 2026: year sees rise in offences
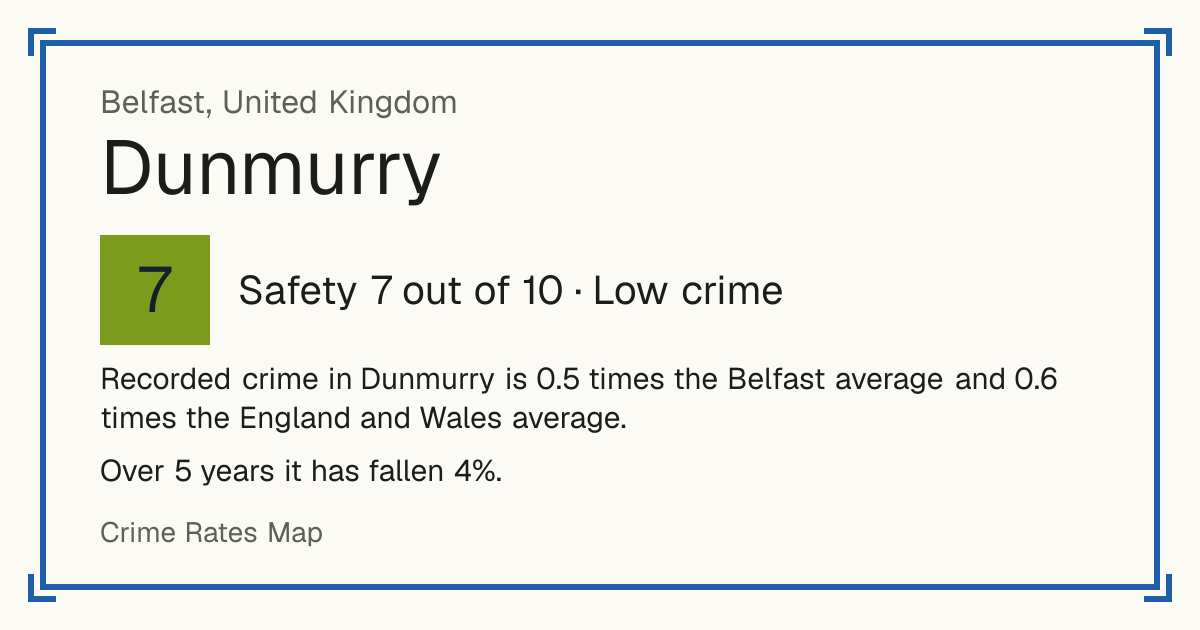
Recorded crime in Dunmurry is 0.5 times the Belfast average and 0.6 times the England and Wales average. Over 5 years it has fallen 4%.
These figures as an image, for sharing.

Questions about crime in Dunmurry

Is Dunmurry a safe place to live?
Dunmurry scores 7 out of 10 for safety (low crime), compared with every neighbourhood in England, Wales and Northern Ireland. Crime severity is 0.5 times the Belfast average.
Is crime going up or down in Dunmurry?
Down 4% over 5 years, from 908 recorded crimes a year to 873.
What is the most common crime in Dunmurry?
The most common recorded crime is violence and sexual offences (assaults, harassment, sexual offences), about 20 per 1,000 residents a year.
How does crime in Dunmurry compare with Belfast?
Crime severity in Dunmurry is 0.5 times the Belfast average.