Crime in Cheadle Hulme
Recorded crime in Cheadle Hulme is 0.7 times the Stockport average and 0.7 times the England and Wales average. The police force here stopped publishing data after June 2019. The biggest share of the harm comes from burglary.
Within 1.5 km of the centre of Cheadle Hulme: about 22,323 residents in 25 neighbourhoods.
- Safety in the UK
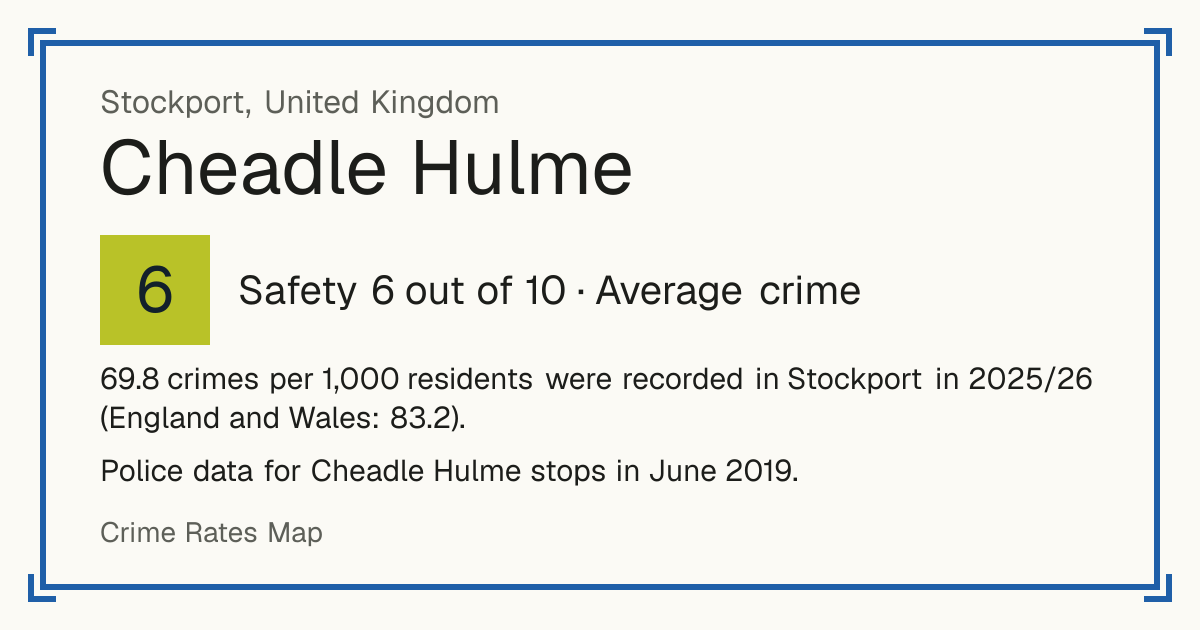
- 6/10Average crime (data up to 2019)
- Living
- 8.1/10Good
- vs the council
- 0.7×the Stockport average
Crime in Stockport now
The police force here has published no street-level crime for Cheadle Hulme since June 2019, so the map and scores below are from before then. These are the latest Home Office figures for the whole council area, April 2025 to March 2026.
69.8 crimes per 1,000 residents were recorded in Stockport in 2025/26 (England and Wales: 83.2).
Greater Manchester Police did not assign 5.9% of the crimes it recorded in 2025/26 to a council area, so these figures are lower than the true count.
| Type | Crimes in 2025/26 | Per 1,000 residents | Change on 2024/25 |
|---|---|---|---|
| Cars stolen | 393 | 1.3 | Down 10% |
| Cars broken into | 509 | 1.7 | Up 8% |
| Vehicle tampering | 168 | 0.55 | Down 5% |
| Vandalism to homes | 574 | 1.9 | Down 11% |
| Vandalism to other buildings | 354 | 1.2 | About the same |
| Vandalism to vehicles | 575 | 1.9 | Down 14% |
| Arson | 108 | 0.36 | Up 5% |
| Burglary of homes | 574 | 1.9 | Down 17% |
| Burglary of businesses | 224 | 0.74 | Down 14% |
| Homicide (murder and manslaughter) | 1 | - | - |
| Carrying a knife or blade | 134 | 0.44 | Down 32% |
| Carrying other weapons (including guns) | 143 | 0.47 | Down 11% |
| Robbery of people | 224 | 0.74 | Down 28% |
| Robbery of businesses | 100 | 0.33 | Up 92% |
| Violence with injury | 1,772 | 5.8 | Down 8% |
| Violence without injury | 3,579 | 11.8 | Down 6% |
| Stalking and harassment | 2,865 | 9.4 | Down 9% |
| Sexual offences | 803 | 2.6 | Down 8% |
| Shoplifting | 1,919 | 6.3 | Down 8% |
| Bicycle theft | 169 | 0.56 | Down 6% |
| Theft from the person (pickpocketing, bag snatching) | 96 | 0.32 | Down 30% |
| Drug dealing | 291 | 0.96 | Down 11% |
| Drug possession | 622 | 2.0 | Up 25% |
Under 10 a year: no rate or change, the numbers are too small to compare. These are council-area figures: police.uk street-level data, used for the map and the Safety score, only has the broad categories, and no source publishes murders or stabbings by street. Source: Home Office, police recorded crime by community safety partnership.
Greater Manchester Police area: 2,831 offences involving a knife or sharp instrument in 2025/26 (3,425 the year before). This covers the whole police force area, not only Stockport.
Source: Home Office, police recorded knife crime by police force.
Neighbourhoods by Safety
Within 1.5 km of the centre of Cheadle Hulme.
Postcode districts in Cheadle Hulme
Nearby towns
Council: Stockport
Questions about crime in Cheadle Hulme
- Is Cheadle Hulme a safe place to live?
- Cheadle Hulme scores 6 out of 10 for safety (average crime), compared with every neighbourhood in England, Wales and Northern Ireland. Crime severity is 0.7 times the Stockport average. Police data here stops in June 2019.
- What is the most common crime in Cheadle Hulme?
- The most common recorded crime is violence and sexual offences (assaults, harassment, sexual offences), about 13 per 1,000 residents a year. The most harm, weighted by how serious each crime is, comes from burglary. Police data here stops in June 2019.
- How does crime in Cheadle Hulme compare with Stockport?
- Crime severity in Cheadle Hulme is 0.7 times the Stockport average. Police data here stops in June 2019.
- How many cars are stolen in Cheadle Hulme?
- In Stockport, the council area Cheadle Hulme is in, the police recorded 393 cars stolen in 2025/26 (April 2025 to March 2026), 1.3 per 1,000 residents, down 10% on the year before.
- Is vandalism common in Cheadle Hulme?
- 1,503 acts of vandalism to homes, other buildings and vehicles were recorded in 2025/26, in Stockport, the council area Cheadle Hulme is in, 4.9 per 1,000 residents, about the England and Wales average.
- How many murders were there in Cheadle Hulme last year?
- 1 homicide (murder or manslaughter) was recorded in 2025/26, in Stockport, the council area Cheadle Hulme is in, against 0 the year before. Police data does not say where in the area they happened.