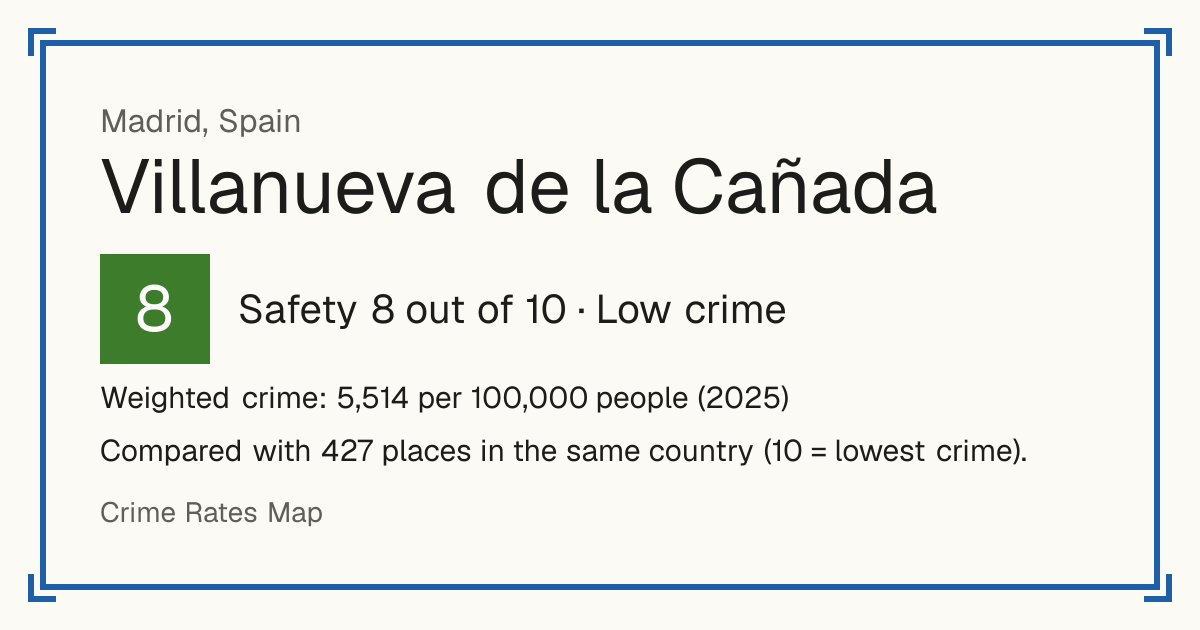
8Villanueva de la Cañada
Villanueva de la Cañada, Spain: crime rate and Safety score
Safety 8 out of 10 Low crime
8/10 in Spain · 10/10 in the world
Compared with 427 places in the same country (10 = lowest crime).
Weighted crime: 5,514 per 100,000 people (2025)
Crime by type, as recorded by Ministerio del Interior (2025)
| Type | Count | Per 100,000 a year | All places this source covers |
|---|---|---|---|
| Homicide | |||
| Murder and intentional homicide | 0 | 0 | 0.8 |
| Attempted murder and homicide | 0 | 0 | 2.9 |
| Sexual offences | |||
| Sexual offences | 8 | 33.3 | 43.9 |
| Violence | |||
| Assault causing injury and brawls | 8 | 33.3 | 64.9 |
| Kidnapping | 0 | 0 | 0.2 |
| Robbery | |||
| Robbery with violence or threats | 7 | 29.1 | 129.2 |
| Theft and burglary | |||
| Burglary of homes, businesses and other premises | 63 | 262.2 | 207 |
| Theft | 278 | 1,157 | 1,313.7 |
| Taking without force or violence; robbery and burglary are counted on their own lines. | |||
| Vehicle theft | 9 | 37.5 | 67.5 |
| Drugs | |||
| Drug trafficking | 0 | 0 | 45.8 |
| Other | |||
| Other conventional crime | 329 | 1,369.2 | 2,197.4 |
| Everything else the police record, except cybercrime, which is not tied to a place. | |||
Source: Ministerio del Interior, updated 28 October 2026.
Recorded crime by type (2025)
| Homicide | 0 |
|---|---|
| Sexual offences | 8 |
| Violence | 8 |
| Robbery | 7 |
| Theft and burglary | 350 |
| Drugs | 0 |
| Other | 329 |
Questions about crime in Villanueva de la Cañada
- Is Villanueva de la Cañada safe?
- Villanueva de la Cañada: Safety 8 out of 10 (Low crime). Compared with 427 places in the same country (10 = lowest crime).
- What is the crime rate in Villanueva de la Cañada?
- Villanueva de la Cañada: Weighted crime: 5,514 per 100,000 people (2025).
- How many murders are there in Villanueva de la Cañada?
- Recorded homicides in Villanueva de la Cañada (2025): 0.
Living
4/10 Living 4 out of 10, compared with other places in the same country.
Raw score 8.5 out of 10, before ranking.
- Schools: 10/10
- Transport: 5/10
- Health: 9/10
- Supermarkets: 10/10
Nearest places
- School: Equipo de Orientación Educativa y Psicopedagógica Atencion Temprana Villanueva de la Cañada 110 m
- School: Equipo de Orientación Educativa y Psicopedagógica General Valdemorillo-El Escorial 120 m
- School: Centro Público de Educación de Personas Adultas La Mesta 220 m
- School: Centro Docente Extranjero En España Lycee Moliere (francés) 360 m
- School: Centro Privado de Educación Infantil, Primaria y Secundaria Colegio Internacional Kolbe 920 m
- Bus stop: Empedrada - Real 130 m
- Bus stop: Empedrada - Real 150 m
- Bus stop: Eras de Móstoles - Centro de Salud 200 m
- Doctor or clinic: Centro de Salud Villanueva de la Cañada 200 m
- A&E: Villafranca dental 5.1 km
- Supermarket: Supermercados Día 250 m
- Supermarket: Alcampo 800 m
Schools count by distance only: there are no inspection grades to use.
Other places nearby
- Majadahonda 4/10
- Boadilla del Monte 10/10
- Las Rozas de Madrid 8/10
- Villaviciosa de Odón 6/10
- Galapagar 7/10
- Torrelodones 8/10
- Pozuelo de Alarcón 10/10
- Navalcarnero 8/10