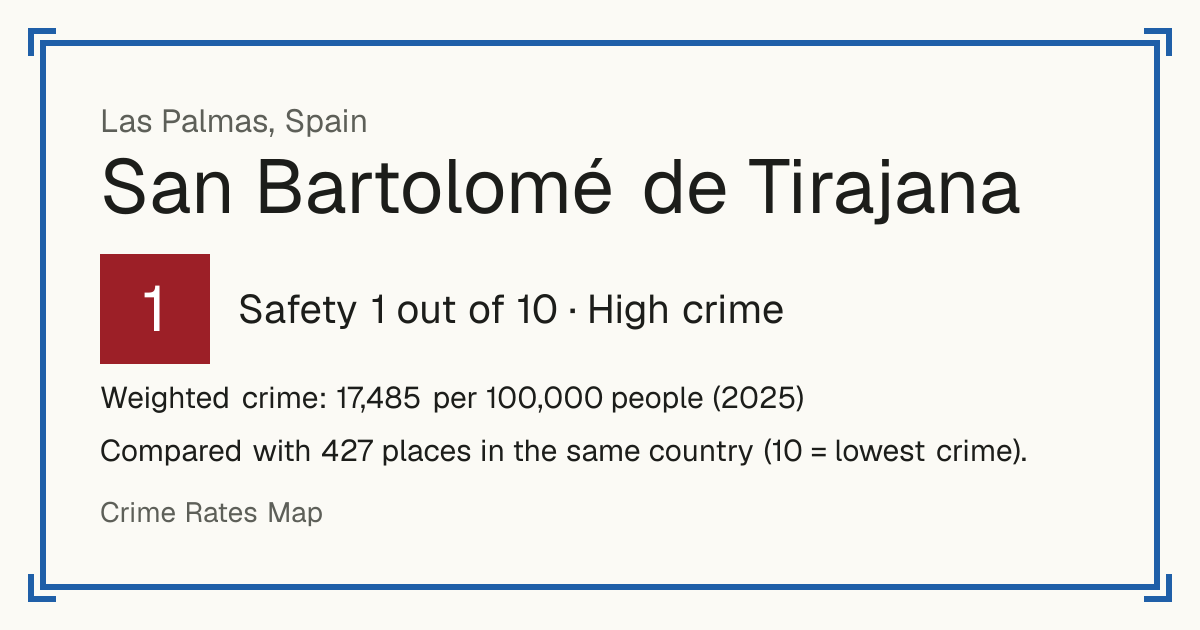
1San Bartolomé de Tirajana
San Bartolomé de Tirajana, Spain: crime rate and Safety score
Safety 1 out of 10 High crime
1/10 in Spain · 7/10 in the world
Compared with 427 places in the same country (10 = lowest crime).
Weighted crime: 17,485 per 100,000 people (2025)
Crime by type, as recorded by Ministerio del Interior (2025)
| Type | Count | Per 100,000 a year | All places this source covers |
|---|---|---|---|
| Homicide | |||
| Murder and intentional homicide | 2 | 3.7 | 0.8 |
| Attempted murder and homicide | 7 | 12.9 | 2.9 |
| Sexual offences | |||
| Sexual offences | 36 | 66.3 | 43.9 |
| Violence | |||
| Assault causing injury and brawls | 51 | 93.9 | 64.9 |
| Kidnapping | 2 | 3.7 | 0.2 |
| Robbery | |||
| Robbery with violence or threats | 92 | 169.5 | 129.2 |
| Theft and burglary | |||
| Burglary of homes, businesses and other premises | 114 | 210 | 207 |
| Theft | 2,002 | 3,687.5 | 1,313.7 |
| Taking without force or violence; robbery and burglary are counted on their own lines. | |||
| Vehicle theft | 67 | 123.4 | 67.5 |
| Drugs | |||
| Drug trafficking | 71 | 130.8 | 45.8 |
| Other | |||
| Other conventional crime | 2,099 | 3,866.2 | 2,197.4 |
| Everything else the police record, except cybercrime, which is not tied to a place. | |||
Source: Ministerio del Interior, updated 28 October 2026.
Recorded crime by type (2025)
| Homicide | 9 |
|---|---|
| Sexual offences | 36 |
| Violence | 53 |
| Robbery | 92 |
| Theft and burglary | 2,183 |
| Drugs | 71 |
| Other | 2,099 |
Questions about crime in San Bartolomé de Tirajana
- Is San Bartolomé de Tirajana safe?
- San Bartolomé de Tirajana: Safety 1 out of 10 (High crime). Compared with 427 places in the same country (10 = lowest crime).
- What is the crime rate in San Bartolomé de Tirajana?
- San Bartolomé de Tirajana: Weighted crime: 17,485 per 100,000 people (2025).
- How many murders are there in San Bartolomé de Tirajana?
- Recorded homicides in San Bartolomé de Tirajana (2025): 9.
Other places nearby