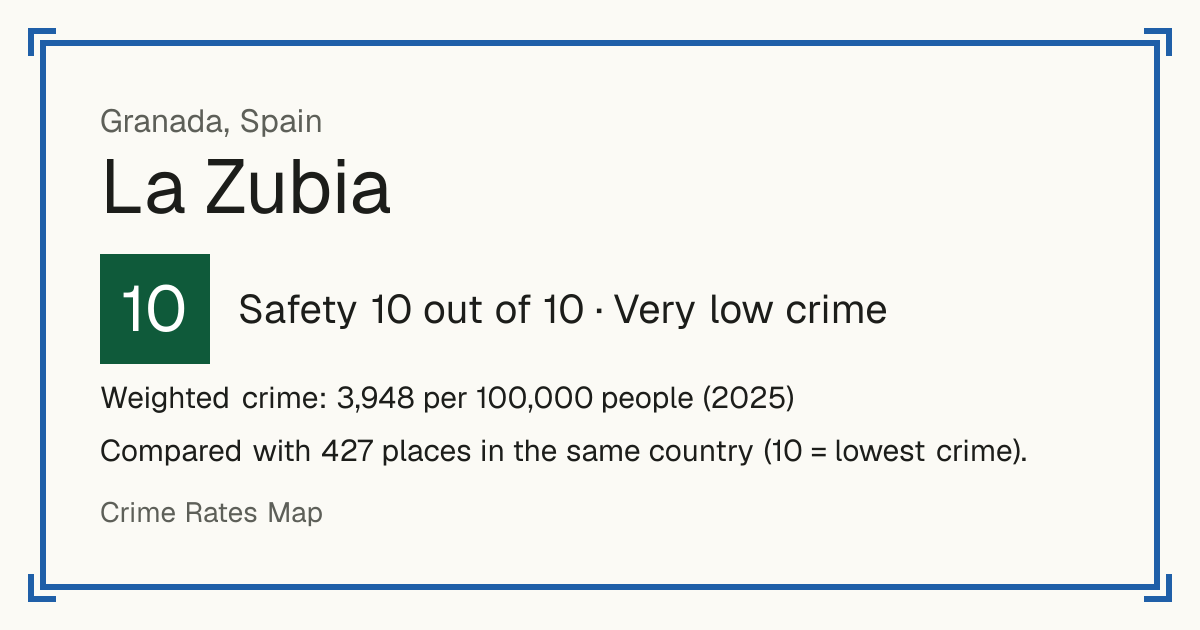
10La Zubia
La Zubia, Spain: crime rate and Safety score
Safety 10 out of 10 Very low crime
10/10 in Spain · 10/10 in the world
Compared with 427 places in the same country (10 = lowest crime).
Weighted crime: 3,948 per 100,000 people (2025)
Crime by type, as recorded by Ministerio del Interior (2025)
| Type | Count | Per 100,000 a year | All places this source covers |
|---|---|---|---|
| Homicide | |||
| Murder and intentional homicide | 0 | 0 | 0.8 |
| Attempted murder and homicide | 0 | 0 | 2.9 |
| Sexual offences | |||
| Sexual offences | 7 | 34.3 | 43.9 |
| Violence | |||
| Assault causing injury and brawls | 6 | 29.4 | 64.9 |
| Kidnapping | 0 | 0 | 0.2 |
| Robbery | |||
| Robbery with violence or threats | 5 | 24.5 | 129.2 |
| Theft and burglary | |||
| Burglary of homes, businesses and other premises | 33 | 161.9 | 207 |
| Theft | 86 | 421.8 | 1,313.7 |
| Taking without force or violence; robbery and burglary are counted on their own lines. | |||
| Vehicle theft | 3 | 14.7 | 67.5 |
| Drugs | |||
| Drug trafficking | 10 | 49 | 45.8 |
| Other | |||
| Other conventional crime | 301 | 1,476.3 | 2,197.4 |
| Everything else the police record, except cybercrime, which is not tied to a place. | |||
Source: Ministerio del Interior, updated 28 October 2026.
Recorded crime by type (2025)
| Homicide | 0 |
|---|---|
| Sexual offences | 7 |
| Violence | 6 |
| Robbery | 5 |
| Theft and burglary | 122 |
| Drugs | 10 |
| Other | 301 |
Living
4/10 Living 4 out of 10, compared with other places in the same country.
Raw score 8.3 out of 10, before ranking.
- Schools: 10/10
- Transport: 4/10
- Health: 10/10
- Supermarkets: 9/10
Nearest places
- School: Colegio de Educación Infantil y Primaria Al-Zawiya 380 m
- School: Colegio de Educación Infantil y Primaria Isabel la Católica 440 m
- School: Instituto de Educación Secundaria Trevenque 1.1 km
- School: Instituto de Educación Secundaria Laurel de la Reina 1.2 km
- School: Colegio de Educación Infantil y Primaria Tierno Galván 1.2 km
- Bus stop: Segadores 220 m
- Bus stop: Pasaje de Satajardas 330 m
- Bus stop: Polideportivo 370 m
- Railway station: Dílar 4.5 km
- Doctor or clinic: Centro de Salud La Zubia 500 m
- A&E: Hospital Universitario Clínico San Cecilio 4.7 km
- Supermarket: Dani 620 m
- Supermarket: Supersol 840 m
Schools count by distance only: there are no inspection grades to use.