NLNetherlands
Netherlands: crime, homicide rate and trend
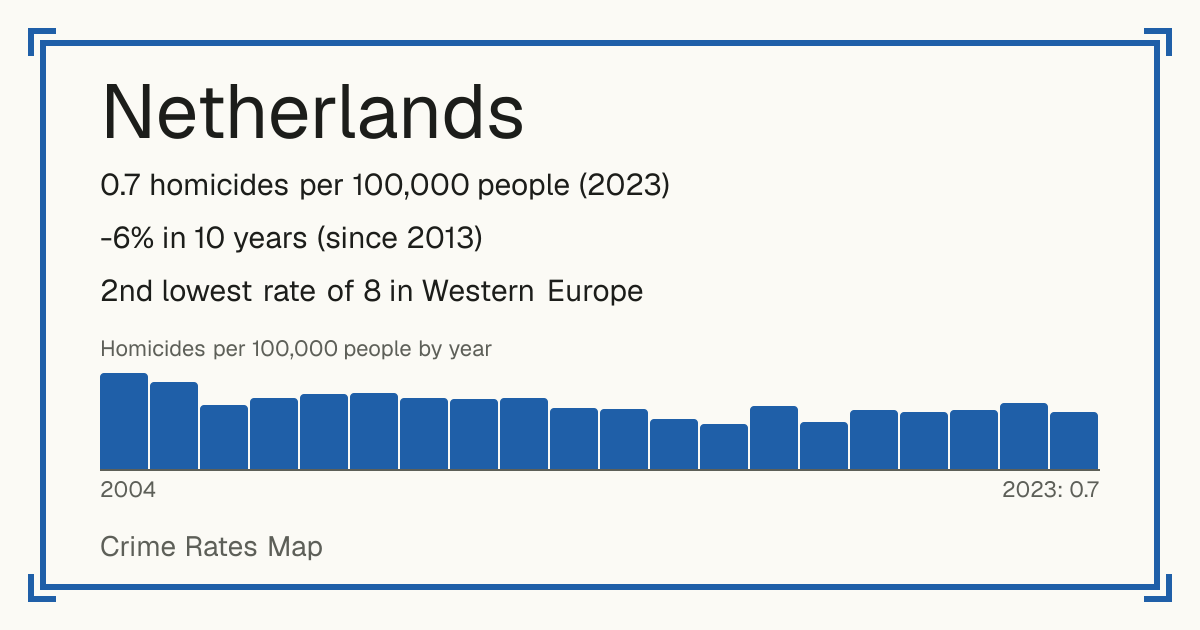
- 0.7 homicides per 100,000 people (2023)
- -6% in 10 years (since 2013)
- 2nd lowest rate of 8 in Western Europe
- World median: 3.8 per 100,000
- Source: World Bank, from UNODC, 2023.
Safety 8 out of 10 compared with the world
Places in Netherlands
- 's-Gravenhage
- 's-Hertogenbosch
- Aa en Hunze
- Aalsmeer
- Aalten
- Achtkarspelen
- Alblasserdam
- Albrandswaard
- Alkmaar
- Almelo
- Almere
- Alphen aan den Rijn
- Alphen-Chaam
- Altena
- Ameland
- Amersfoort
- Amstelveen
- Amsterdam
- Apeldoorn
- Arnhem
- Assen
- Asten
- Baarle-Nassau
- Baarn
- Barendrecht
- Barneveld
- Beek (L.)
- Beekdaelen
- Beesel
- Berg en Dal
- Bergeijk
- Bergen (L.)
- Bergen (NH.)
- Bergen op Zoom
- Berkelland
- Bernheze
- Best
- Beuningen
- Beverwijk
- Bladel
- Blaricum
- Bloemendaal
- Bodegraven-Reeuwijk
- Boekel
- Borger-Odoorn
- Borne
- Borsele
- Boxtel
- Breda
- Bronckhorst
- Brummen
- Brunssum
- Bunnik
- Bunschoten
- Buren
- Capelle aan den IJssel
- Castricum
- Coevorden
- Cranendonck
- Culemborg
- Dalfsen
- Dantumadiel
- De Bilt
- De Fryske Marren
- De Ronde Venen
- De Wolden
- Delft
- Den Helder
- Deurne
- Deventer
- Diemen
- Dijk en Waard
- Dinkelland
- Doesburg
- Doetinchem
- Dongen
- Dordrecht
- Drechterland
- Drimmelen
- Dronten
- Druten
- Duiven
- Echt-Susteren
- Edam-Volendam
- Ede
- Eemnes
- Eemsdelta
- Eersel
- Eijsden-Margraten
- Eindhoven
- Elburg
- Emmen
- Enkhuizen
- Enschede
- Epe
- Ermelo
- Etten-Leur
- Geertruidenberg
- Geldrop-Mierlo
- Gemeente onbekend
- Gemert-Bakel
- Gennep
- Gilze en Rijen
- Goeree-Overflakkee
- Goes
- Goirle
- Gooise Meren
- Gorinchem
- Gouda
- Groningen
- Gulpen-Wittem
- Haaksbergen
- Haarlem
- Haarlemmermeer
- Halderberge
- Hardenberg
- Harderwijk
- Hardinxveld-Giessendam
- Harlingen
- Hattem
- Heemskerk
- Heemstede
- Heerde
- Heerenveen
- Heerlen
- Heeze-Leende
- Heiloo
- Hellendoorn
- Helmond
- Hendrik-Ido-Ambacht
- Hengelo (O.)
- Het Hogeland
- Heumen
- Heusden
- Hillegom
- Hilvarenbeek
- Hilversum
- Hoeksche Waard
- Hof van Twente
- Hollands Kroon
- Hoogeveen
- Hoorn
- Horst aan de Maas
- Houten
- Huizen
- Hulst
- IJsselstein
- Kaag en Braassem
- Kampen
- Kapelle
- Katwijk
- Kerkrade
- Koggenland
- Krimpen aan den IJssel
- Krimpenerwaard
- Laarbeek
- Land van Cuijk
- Landgraaf
- Landsmeer
- Lansingerland
- Laren (NH.)
- Leeuwarden
- Leiden
- Leiderdorp
- Leidschendam-Voorburg
- Lelystad
- Leudal
- Leusden
- Lingewaard
- Lisse
- Lochem
- Loon op Zand
- Lopik
- Losser
- Maasdriel
- Maasgouw
- Maashorst
- Maassluis
- Maastricht
- Medemblik
- Meerssen
- Meierijstad
- Meppel
- Middelburg (Z.)
- Midden-Delfland
- Midden-Drenthe
- Midden-Groningen
- Moerdijk
- Molenlanden
- Montferland
- Montfoort
- Mook en Middelaar
- Neder-Betuwe
- Nederweert
- Nieuwegein
- Nieuwkoop
- Nijkerk
- Nijmegen
- Nissewaard
- Noardeast-Fryslân
- Noord-Beveland
- Noordenveld
- Noordoostpolder
- Noordwijk
- Nuenen, Gerwen en Nederwetten
- Nunspeet
- Oegstgeest
- Oirschot
- Oisterwijk
- Oldambt
- Oldebroek
- Oldenzaal
- Olst-Wijhe
- Ommen
- Oost Gelre
- Oosterhout
- Ooststellingwerf
- Oostzaan
- Opmeer
- Opsterland
- Oss
- Oude IJsselstreek
- Ouder-Amstel
- Oudewater
- Overbetuwe
- Papendrecht
- Peel en Maas
- Pekela
- Pijnacker-Nootdorp
- Purmerend
- Putten
- Raalte
- Reimerswaal
- Renkum
- Renswoude
- Reusel-De Mierden
- Rheden
- Rhenen
- Ridderkerk
- Rijssen-Holten
- Rijswijk (ZH.)
- Roerdalen
- Roermond
- Roosendaal
- Rotterdam
- Rozendaal
- Rucphen
- Schagen
- Scherpenzeel
- Schiedam
- Schiermonnikoog
- Schouwen-Duiveland
- Simpelveld
- Sint-Michielsgestel
- Sittard-Geleen
- Sliedrecht
- Sluis
- Smallingerland
- Soest
- Someren
- Son en Breugel
- Stadskanaal
- Staphorst
- Stede Broec
- Steenbergen
- Steenwijkerland
- Stein (L.)
- Stichtse Vecht
- Súdwest-Fryslân
- Terneuzen
- Terschelling
- Texel
- Teylingen
- Tholen
- Tiel
- Tilburg
- Tubbergen
- Twenterand
- Tynaarlo
- Tytsjerksteradiel
- Uitgeest
- Uithoorn
- Urk
- Utrecht
- Utrechtse Heuvelrug
- Vaals
- Valkenburg aan de Geul
- Valkenswaard
- Veendam
- Veenendaal
- Veere
- Veldhoven
- Velsen
- Venlo
- Venray
- Vijfheerenlanden
- Vlaardingen
- Vlieland
- Vlissingen
- Voerendaal
- Voorne aan Zee
- Voorschoten
- Voorst
- Vught
- Waadhoeke
- Waalre
- Waalwijk
- Waddinxveen
- Wageningen
- Wassenaar
- Waterland
- Weert
- West Betuwe
- West Maas en Waal
- Westerkwartier
- Westerveld
- Westervoort
- Westerwolde
- Westland
- Weststellingwerf
- Wierden
- Wijchen
- Wijdemeren
- Wijk bij Duurstede
- Winterswijk
- Woensdrecht
- Woerden
- Wormerland
- Woudenberg
- Zaanstad
- Zaltbommel
- Zandvoort
- Zeewolde
- Zeist
- Zevenaar
- Zoetermeer
- Zoeterwoude
- Zuidplas
- Zundert
- Zutphen
- Zwartewaterland
- Zwijndrecht
- Zwolle
Crime recorded by the police (2024)
| Crime | Recorded | Per 100,000 |
|---|---|---|
| Intentional homicide | 120 | 0.7 |
| Serious assault | 4,760 | 26.5 |
| Kidnapping | 490 | 2.7 |
| Sexual violence | 4,330 | 24.1 |
| of which: Rape | 2,415 | 13.5 |
| of which: Sexual assault | 1,915 | 10.7 |
| Sexual exploitation | 665 | 3.7 |
| Robbery | 6,325 | 35.3 |
| Burglary | 33,055 | 184.2 |
| of which: Burglary of homes | 20,995 | 117 |
| Theft | 238,730 | 1,330.5 |
| of which: Theft of vehicles or parts | 24,175 | 134.7 |
| Drug offences | 14,470 | 80.6 |
| Corruption | 5,590 | 31.2 |
| Money laundering | 1,475 | 8.2 |
| Attacks on computer systems (2019) | 4,865 | 28.2 |
| Environmental pollution (2023) | 380 | 2.1 |
| Illegal waste movement or dumping (2023) | 210 | 1.2 |
| Trade in protected species (2023) | 5 | 0 |
| Depletion of natural resources (2023) | 0 | 0 |
Each country defines and records crime in its own way, so these figures compare a country with itself over time better than with other countries.
Homicides per 100,000 people by year
| Year | Per 100,000 |
|---|---|
| 2023 | 0.7 |
| 2022 | 0.8 |
| 2021 | 0.7 |
| 2020 | 0.7 |
| 2019 | 0.7 |
| 2018 | 0.6 |
| 2017 | 0.8 |
| 2016 | 0.5 |
| 2015 | 0.6 |
| 2014 | 0.7 |
| 2013 | 0.7 |
| 2012 | 0.9 |
| 2011 | 0.8 |
| 2010 | 0.9 |
| 2009 | 0.9 |
| 2008 | 0.9 |
| 2007 | 0.9 |
| 2006 | 0.8 |
| 2005 | 1.1 |
| 2004 | 1.2 |
| 2003 | 1.2 |
| 2002 | 1.2 |
| 2001 | 1.2 |
| 2000 | 1.1 |