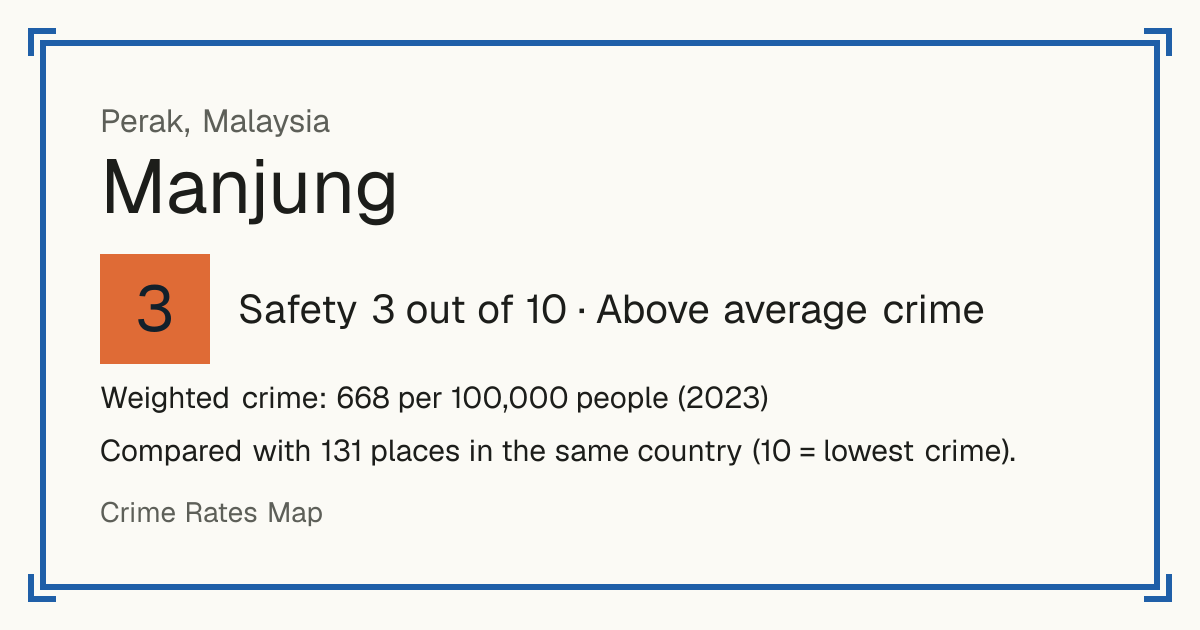
3Manjung
Manjung, Malaysia: crime rate and Safety score
Safety 3 out of 10 Above average crime
3/10 in Malaysia · 8/10 in the world
Compared with 131 places in the same country (10 = lowest crime).
Weighted crime: 668 per 100,000 people (2023)
Crime by type, as recorded by Royal Malaysia Police (2023)
| Type | Count | Per 100,000 a year | All places this source covers |
|---|---|---|---|
| Homicide | |||
| Murder | 5 | 2 | 0.8 |
| Sexual offences | |||
| Rape | 17 | 6.7 | 5.8 |
| Violence | |||
| Assault causing injury | 30 | 11.9 | 11.1 |
| Malaysia's index crime: hurt caused on purpose; common assault and threats are not in this dataset. | |||
| Robbery | |||
| Armed gang robbery | 1 | 0.4 | 0.1 |
| Unarmed gang robbery | 7 | 2.8 | 7.8 |
| Armed robbery by one person | 0 | 0 | 0 |
| Unarmed robbery by one person | 7 | 2.8 | 5.9 |
| Theft and burglary | |||
| Burglary | 55 | 21.8 | 34.9 |
| Car theft | 33 | 13.1 | 9.8 |
| Motorbike theft | 54 | 21.4 | 32 |
| Lorry and van theft | 2 | 0.8 | 2.3 |
| Other theft | 69 | 27.3 | 47.8 |
Source: Royal Malaysia Police, updated 26 October 2026.
Recorded crime by type (2023)
| Homicide | 5 |
|---|---|
| Sexual offences | 17 |
| Violence | 30 |
| Robbery | 15 |
| Theft and burglary | 213 |