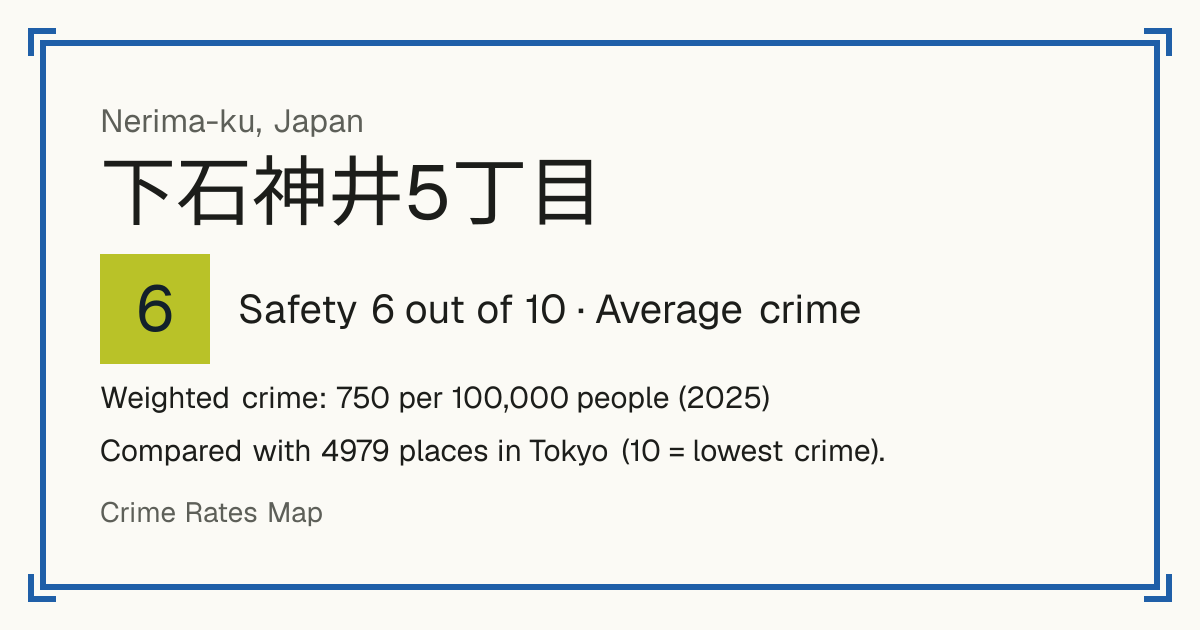
6下石神井5丁目
下石神井5丁目, Japan: crime rate and Safety score
Safety 6 out of 10 Average crime
6/10 in Tokyo · 10/10 in the world
Compared with 4979 places in Tokyo (10 = lowest crime). 360 places were left out of the comparison (incomplete figures or very few residents).
Weighted crime: 750 per 100,000 people (2025)
Residents: 2,666
How accurate: in 2025, 52% of the 4,903 neighbourhoods compared scored within 1 of their 2024 score.
Crime by type, as recorded by Tokyo Metropolitan Police (2025)
| Type | Count | Per 100,000 a year | All places this source covers |
|---|---|---|---|
| Violence | |||
| Murder, arson and rape | 0 | 0 | 5.3 |
| Tokyo publishes these serious crimes together at chōme level, so they cannot be shown apart. | |||
| Violent crime (assault, injury, threats, extortion) | 1 | 37.5 | 61.9 |
| Robbery | |||
| Robbery | 0 | 0 | 1.8 |
| Theft and burglary | |||
| Burglary | 0 | 0 | 18.9 |
| Theft without break-in | 5 | 187.5 | 420.5 |
| Includes bicycle theft, shoplifting and pickpocketing. | |||
Source: Tokyo Metropolitan Police, updated 28 October 2026.
Recorded crime by type (2025)
| Violence | 1 |
|---|---|
| Robbery | 0 |
| Theft and burglary | 5 |
Questions about crime in 下石神井5丁目
- Is 下石神井5丁目 safe?
- 下石神井5丁目: Safety 6 out of 10 (Average crime). Compared with 4979 places in Tokyo (10 = lowest crime). 360 places were left out of the comparison (incomplete figures or very few residents).
- What is the crime rate in 下石神井5丁目?
- 下石神井5丁目: Weighted crime: 750 per 100,000 people (2025).