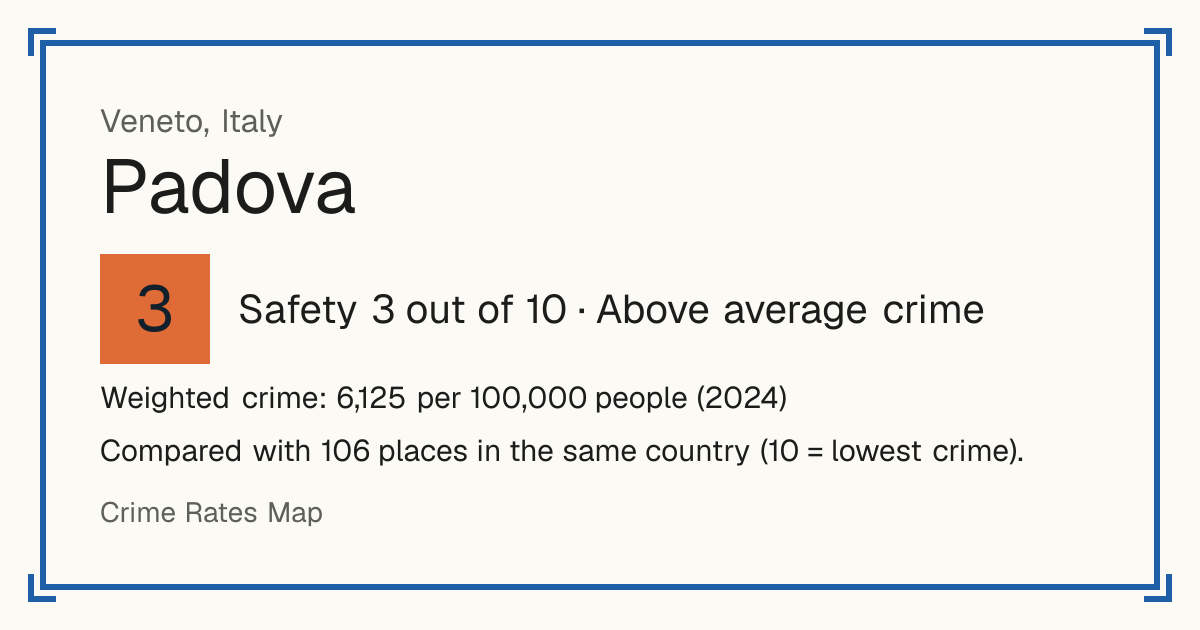
3Padova
Padova, Italy: crime rate and Safety score
Safety 3 out of 10 Above average crime
3/10 in Italy · 8/10 in the world
Compared with 106 places in the same country (10 = lowest crime).
Weighted crime: 6,125 per 100,000 people (2024)
Crime by type, as recorded by Istat (2024)
| Type | Count | Per 100,000 a year | All places this source covers |
|---|---|---|---|
| Homicide | |||
| Intentional homicide | 4 | 0.4 | 0.6 |
| Sexual offences | |||
| Sexual violence | 126 | 13.5 | 11.6 |
| Sexual acts with a minor | 6 | 0.6 | 1 |
| Violence | |||
| Intentional injury | 965 | 103.6 | 114.2 |
| Assault without injury | 327 | 35.1 | 30.8 |
| Kidnapping | 15 | 1.6 | 1.2 |
| Robbery | |||
| Robbery | 387 | 41.5 | 49 |
| Theft and burglary | |||
| Theft, all kinds | 16,238 | 1,743 | 1,797.9 |
| Drugs | |||
| Drug production, trafficking and illegal holding | 830 | 89.1 | 56.5 |
| Damage and public order | |||
| Criminal damage | 3,694 | 396.5 | 473.9 |
| Damage by arson | 23 | 2.5 | 12.7 |
Source: Istat, updated 26 October 2026.
Recorded crime by type (2024)
| Homicide | 4 |
|---|---|
| Sexual offences | 132 |
| Violence | 1,307 |
| Robbery | 387 |
| Theft and burglary | 16,238 |
| Drugs | 830 |
| Damage and public order | 3,717 |
Living
10/10 Living 10 out of 10, compared with other places in the same country.
Raw score 10.0 out of 10, before ranking.
- Schools: 10/10
- Transport: 10/10
- Health: 10/10
- Supermarkets: 10/10
Nearest places
- School: Aula studio Daniele Donghi 300 m
- School: Istituto d'Arte Pietro Selvatico 310 m
- School: II Istituto Comprensivo “Ardigò” 350 m
- School: Liceo Amedeo di Savoia Duca d'Aosta 580 m
- School: Liceo artistico Amedeo Modigliani 590 m
- Bus stop: Belzoni 7 50 m
- Bus stop: Belzoni 7 60 m
- Bus stop: Falloppio 36 100 m
- Railway station: Padova 1.2 km
- Tram or metro stop: Morgagni 80 m
- Doctor or clinic: Poliambulatorio Valentini 850 m
- A&E: Azienda Ospedaliera di Padova 720 m
- Supermarket: La Bottega dei Freschi 380 m
- Supermarket: Coop 560 m
Schools count by distance only: there are no inspection grades to use.
Other places nearby