1Newbridge
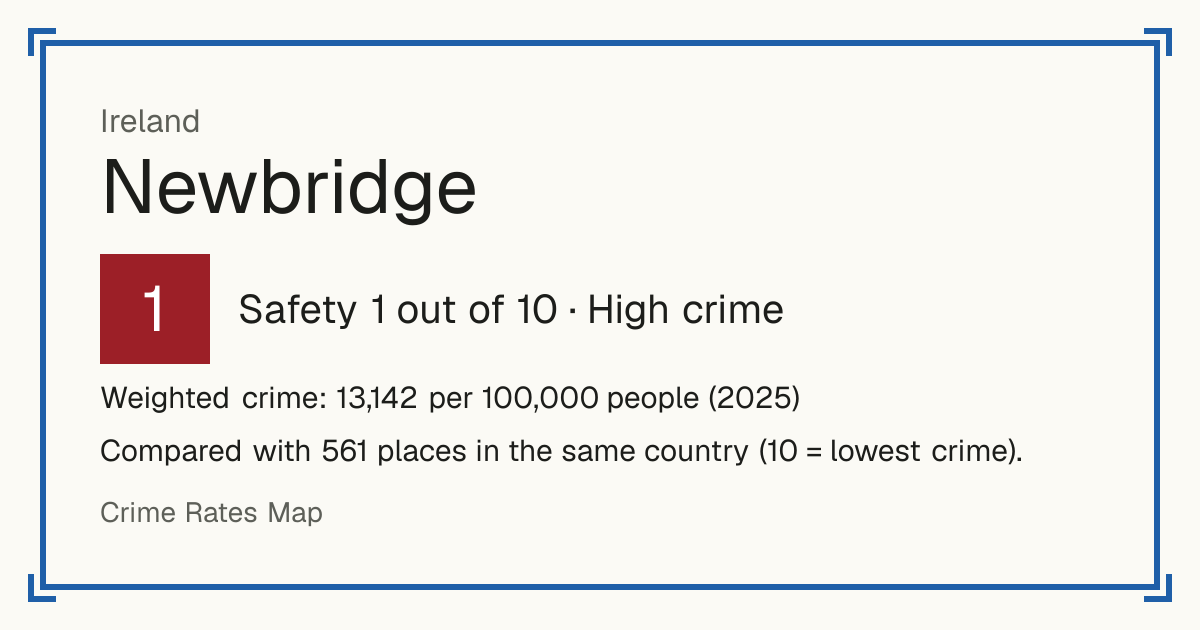
Newbridge, Ireland: crime rate and Safety score
Safety 1 out of 10 High crime
1/10 in Ireland · 8/10 in the world
Compared with 561 places in the same country (10 = lowest crime). 1 places were left out of the comparison (incomplete figures or very few residents).
Weighted crime: 13,142 per 100,000 people (2025)
Crime by type, as recorded by CSO (2025)
| Type | Count | Per 100,000 a year | All places this source covers |
|---|---|---|---|
| Violence | |||
| Assault, harassment and threats to murder | 169 | 614.7 | 552.7 |
| Includes attempted murder. | |||
| Kidnapping and related offences | 0 | 0 | 3.2 |
| Robbery | |||
| Robbery, extortion and hijacking | 12 | 43.7 | 46.4 |
| Theft and burglary | |||
| Burglary | 41 | 149.1 | 184.6 |
| Theft | 552 | 2,007.9 | 1,604.2 |
| Drugs | |||
| Drug offences | 139 | 505.6 | 353.1 |
| Damage and public order | |||
| Damage to property and the environment | 145 | 527.4 | 443.9 |
| Public order offences | 218 | 793 | 680.1 |
Source: CSO, updated 26 October 2026.
Recorded crime by type (2025)
| Violence | 169 |
|---|---|
| Robbery | 12 |
| Theft and burglary | 593 |
| Drugs | 139 |
| Damage and public order | 363 |
Living
9/10 Living 9 out of 10, compared with other places in the same country.
Raw score 6.7 out of 10, before ranking.
- Schools: 9/10
- Transport: 5/10
- Health: 5/10
- Supermarkets: 7/10
Nearest places
- School 940 m
- School: Scoil Mhuire Senior School 980 m
- School: St Marks School 1.2 km
- School 1.8 km
- School: Saint Conleth's Vocational School 1.8 km
- Railway station: Newbridge 1.3 km
- Doctor or clinic: Newbridge Medical & Dental 1.7 km
- A&E: Tallaght University Hospital 32.4 km
- Supermarket: Tesco 1.6 km
- Supermarket: Aldi 1.7 km
Schools count by distance only: there are no inspection grades to use.