ISIceland
Iceland: crime, homicide rate and trend
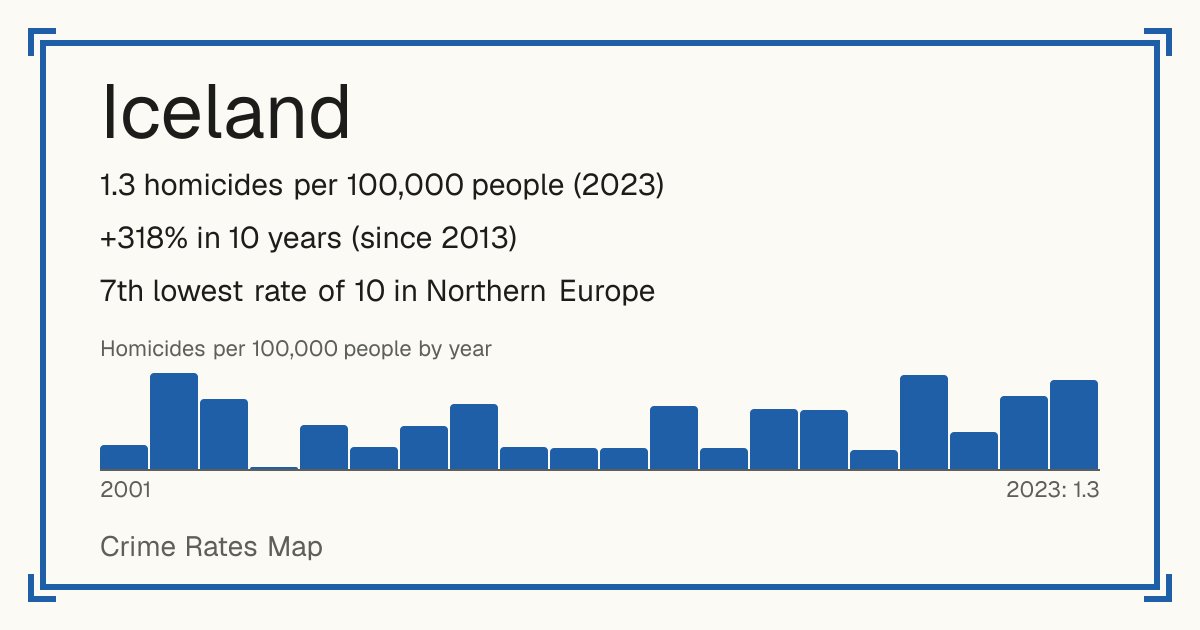
- 1.3 homicides per 100,000 people (2023)
- +318% in 10 years (since 2013)
- 7th lowest rate of 10 in Northern Europe
- World median: 3.8 per 100,000
- Source: World Bank, from UNODC, 2023.
Safety 7 out of 10 compared with the world
Places in Iceland
Crime recorded by the police (2024)
| Crime | Recorded | Per 100,000 |
|---|---|---|
| Intentional homicide | 7 | 1.8 |
| Attempted intentional homicide | 15 | 3.9 |
| Serious assault | 222 | 57.9 |
| Sexual violence | 556 | 145 |
| of which: Rape | 182 | 47.5 |
| of which: Sexual assault | 62 | 16.2 |
| Sexual exploitation (2023) | 0 | 0 |
| of which: Child sexual abuse material (2023) | 37 | 9.5 |
| Robbery | 109 | 28.4 |
| Burglary | 1,168 | 304.5 |
| of which: Burglary of homes | 381 | 99.3 |
| Theft | 3,844 | 1,002.2 |
| of which: Theft of vehicles or parts | 11 | 2.9 |
| Drug offences | 1,762 | 459.4 |
| Fraud | 478 | 124.6 |
| Money laundering | 209 | 54.5 |
Each country defines and records crime in its own way, so these figures compare a country with itself over time better than with other countries.
Homicides per 100,000 people by year
| Year | Per 100,000 |
|---|---|
| 2023 | 1.3 |
| 2022 | 1.1 |
| 2021 | 0.5 |
| 2020 | 1.4 |
| 2019 | 0.3 |
| 2018 | 0.9 |
| 2017 | 0.9 |
| 2016 | 0.3 |
| 2015 | 0.9 |
| 2014 | 0.3 |
| 2013 | 0.3 |
| 2012 | 0.3 |
| 2011 | 0.9 |
| 2010 | 0.6 |
| 2009 | 0.3 |
| 2007 | 0.6 |
| 2006 | 0 |
| 2005 | 1 |
| 2002 | 1.4 |
| 2001 | 0.4 |
| 2000 | 1.8 |