Orvault, France: crime rate and Safety score
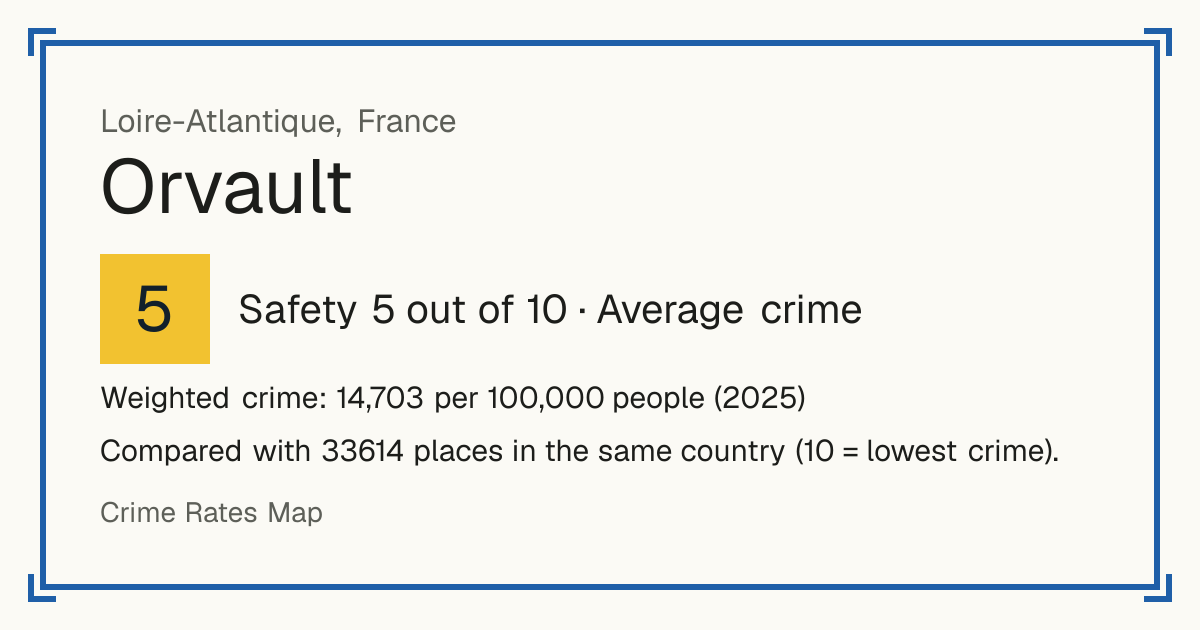
Safety 5 out of 10 Average crime
5/10 in France · 7/10 in the world
Compared with 33614 places in the same country (10 = lowest crime). 1255 places were left out of the comparison (incomplete figures or very few residents).
Weighted crime: 14,703 per 100,000 people (2025)
Crime by type, as recorded by SSMSI (Ministère de l'Intérieur) (2025)
| Type | Count | Per 100,000 a year | All places this source covers |
|---|---|---|---|
| Sexual offences | |||
| Sexual violence | 35 | 122.7 | 193.3 |
| Counts victims, not offences. | |||
| Violence | |||
| Domestic physical violence | 71 | 248.8 | 375.5 |
| Counts victims, not offences. | |||
| Physical violence outside the family | 70 | 245.3 | 315.6 |
| Counts victims, not offences. | |||
| Robbery | |||
| Armed robbery | not published | - | 11.6 |
| Violent theft without a weapon | 17 | 59.6 | 72 |
| Theft and burglary | |||
| Theft from people without violence | 196 | 686.9 | 910.1 |
| Counts victims who reported it, not offences. | |||
| Home burglary | 151 | 529.2 | 309.6 |
| Vehicle theft | 69 | 241.8 | 182.6 |
| Counts vehicles, not offences. | |||
| Theft from vehicles | 159 | 557.2 | 341.5 |
| Counts vehicles, not offences. | |||
| Theft of vehicle parts | 135 | 473.1 | 139.4 |
| Counts vehicles, not offences. | |||
| Drugs | |||
| Drug use | 64 | 224.3 | 453.9 |
| Counts people implicated, not offences; on-the-spot drug fines are not included. | |||
| Drug trafficking | 14 | 49.1 | 84.8 |
| Counts people implicated, not offences. | |||
| Damage and public order | |||
| Deliberate damage | 172 | 602.8 | 788.7 |
| Other | |||
| Fraud and payment card fraud | 196 | 686.9 | 651.7 |
| Counts victims, in the commune where the victim lives, not where the fraud happened. | |||
Source: SSMSI (Ministère de l'Intérieur), updated 28 October 2026.
Recorded crime by type (2025)
| Sexual offences | 35 |
|---|---|
| Violence | 141 |
| Robbery | not published |
| Theft and burglary | 710 |
| Drugs | 78 |
| Damage and public order | 172 |
| Other | 196 |
Questions about crime in Orvault
- Is Orvault safe?
- Orvault: Safety 5 out of 10 (Average crime). Compared with 33614 places in the same country (10 = lowest crime). 1255 places were left out of the comparison (incomplete figures or very few residents).
- What is the crime rate in Orvault?
- Orvault: Weighted crime: 14,703 per 100,000 people (2025).
Living
10/10 Living 10 out of 10, compared with other places in the same country.
Raw score 7.8 out of 10, before ranking.
- Schools: 10/10
- Transport: 3/10
- Health: 9/10
- Supermarkets: 9/10
Nearest places
- School: École primaire privée Saint-Joseph 290 m
- School: École élémentaire Le Vieux Chêne 380 m
- School: Skol Diwan Orvez 850 m
- School: Groupe scolaire Pont Marchand 1.5 km
- Bus stop: Patache 360 m
- Bus stop: Patache 390 m
- Doctor or clinic 450 m
- A&E: Institut de la main 5.7 km
- Supermarket: Spar 570 m
- Supermarket: Grand Frais 1.8 km
Schools count by distance only: there are no inspection grades to use.
Other places nearby
- Treillières 6/10
- Sautron 8/10
- La Chapelle-sur-Erdre 6/10
- Saint-Herblain 3/10
- Nantes 2/10
- Vigneux-de-Bretagne 9/10
- Grandchamp-des-Fontaines 9/10
- Couëron 6/10
Mayors of Orvault since 2014
Orvault: Other right. Département president: Michel Ménard (Union of the left)
Sébastien ARROUËT · Other right
since March 2026
Too early to compare
Jean-Sébastien GUITTON · Other left
July 2020 – March 2026
excludes types not published for this commune
Orvault ▼ −9% · France ▲ +22%
Recorded crime per 1,000 people, the year before taking office vs the latest year in office
Joseph PARPAILLON · Union of the right
March 2014 – July 2020
figures start in 2016
excludes types not published for this commune
Orvault ▼ −21% · France ▼ −13%
Recorded crime per 1,000 people, the year before taking office vs the latest year in office
Maires: Répertoire national des élus and Ministère de l'Intérieur election results. Crime: SSMSI. Licence Ouverte v2.0. Maires 2014: Ministère de l'Intérieur via IdeesLibres (ODbL).