FIFinland
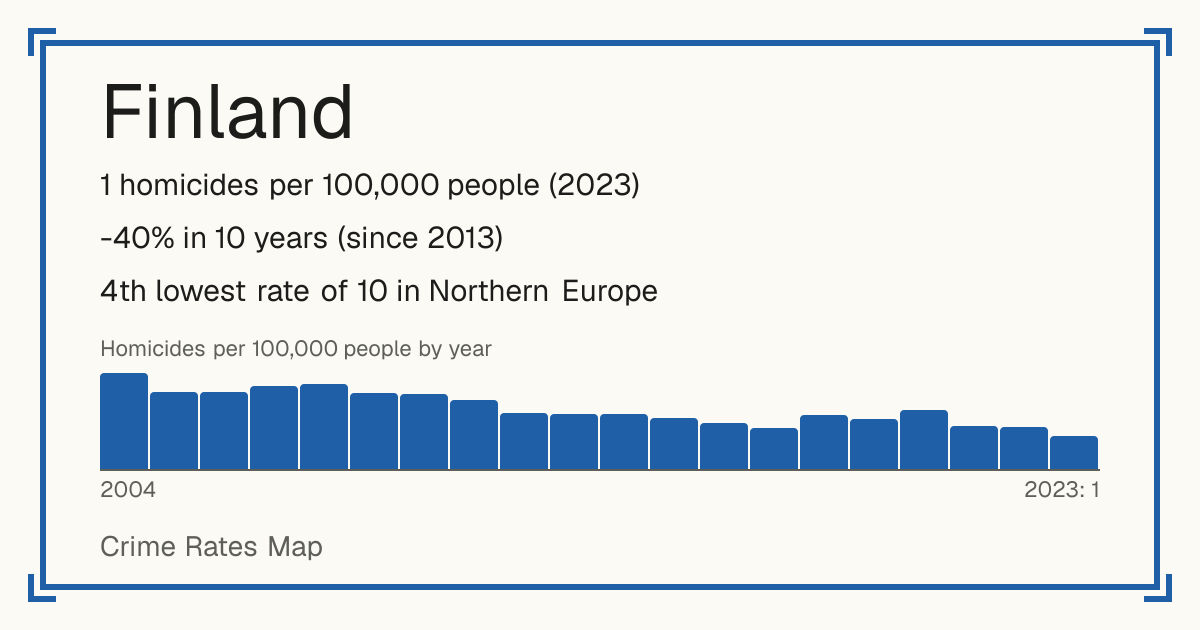
Finland: crime, homicide rate and trend
- 1 homicides per 100,000 people (2023)
- -40% in 10 years (since 2013)
- 4th lowest rate of 10 in Northern Europe
- World median: 3.8 per 100,000
- Source: World Bank, from UNODC, 2023.
Safety 8 out of 10 compared with the world
Living
8/10 Living 8 out of 10: the average of the places in it, on their scale.
Raw score 4.1 out of 10, before ranking.
Places in Finland
- Äänekoski 2/10
- Ähtäri 7/10
- Akaa 2/10
- Alajärvi 8/10
- Alavieska 8/10
- Alavus 6/10
- Asikkala 6/10
- Askola 2/10
- Aura 3/10
- Brändö 10/10
- Eckerö 10/10
- Enonkoski 8/10
- Enontekiö 3/10
- Espoo 2/10
- Eura 5/10
- Eurajoki 8/10
- Evijärvi 9/10
- Finström 5/10
- Föglö 5/10
- Forssa 1/10
- Geta 10/10
- Haapajärvi 7/10
- Haapavesi 5/10
- Hailuoto 8/10
- Halsua 10/10
- Hämeenkyrö 4/10
- Hämeenlinna 1/10
- Hamina 1/10
- Hammarland 4/10
- Hankasalmi 5/10
- Hanko 1/10
- Harjavalta 2/10
- Hartola 6/10
- Hattula 8/10
- Hausjärvi 3/10
- Heinävesi 4/10
- Heinola 4/10
- Helsinki 1/10
- Hirvensalmi 1/10
- Hollola 7/10
- Huittinen 3/10
- Humppila 9/10
- Hyrynsalmi 9/10
- Hyvinkää 2/10
- Ii 6/10
- Iisalmi 2/10
- Iitti 6/10
- Ikaalinen 4/10
- Ilmajoki 5/10
- Ilomantsi 3/10
- Imatra 1/10
- Inari 7/10
- Inkoo 6/10
- Isojoki 9/10
- Isokyrö 3/10
- Jämijärvi 10/10
- Jämsä 2/10
- Janakkala 3/10
- Järvenpää 1/10
- Joensuu 2/10
- Jokioinen 6/10
- Jomala 4/10
- Joroinen 7/10
- Joutsa 7/10
- Juuka 5/10
- Juupajoki 8/10
- Juva 8/10
- Jyväskylä 1/10
- Kaarina 4/10
- Kaavi 1/10
- Kajaani 2/10
- Kalajoki 5/10
- Kangasala 5/10
- Kangasniemi 6/10
- Kankaanpää 6/10
- Kannonkoski 9/10
- Kannus 7/10
- Karijoki 5/10
- Karkkila 2/10
- Kärkölä 9/10
- Kärsämäki 2/10
- Karstula 7/10
- Karvia 6/10
- Kaskinen 10/10
- Kauhajoki 6/10
- Kauhava 5/10
- Kauniainen 5/10
- Kaustinen 6/10
- Keitele 3/10
- Kemi 1/10
- Kemijärvi 4/10
- Keminmaa 4/10
- Kemiönsaari 5/10
- Kempele 7/10
- Kerava 1/10
- Keuruu 3/10
- Kihniö 6/10
- Kinnula 9/10
- Kirkkonummi 3/10
- Kitee 8/10
- Kittilä 4/10
- Kiuruvesi 2/10
- Kivijärvi 7/10
- Kökar 6/10
- Kokemäki 5/10
- Kokkola 1/10
- Kolari 9/10
- Konnevesi 6/10
- Kontiolahti 8/10
- Korsnäs 9/10
- Koski Tl 2/10
- Kotka 1/10
- Kouvola 1/10
- Kristiinankaupunki 9/10
- Kruunupyy 9/10
- Kuhmo 8/10
- Kuhmoinen 10/10
- Kumlinge 10/10
- Kuopio 2/10
- Kuortane 9/10
- Kurikka 5/10
- Kustavi 7/10
- Kuusamo 6/10
- Kyyjärvi 10/10
- Lahti 1/10
- Laihia 8/10
- Laitila 6/10
- Lapinjärvi 6/10
- Lapinlahti 3/10
- Lappajärvi 9/10
- Lappeenranta 1/10
- Lapua 1/10
- Laukaa 4/10
- Lemi 9/10
- Lemland 10/10
- Lempäälä 4/10
- Leppävirta 7/10
- Lestijärvi 9/10
- Lieksa 4/10
- Lieto 4/10
- Liminka 8/10
- Liperi 5/10
- Lohja 1/10
- Loimaa 2/10
- Loppi 7/10
- Loviisa 3/10
- Luhanka 10/10
- Lumijoki 7/10
- Lumparland 10/10
- Luoto 10/10
- Luumäki 6/10
- Maalahti 10/10
- Maarianhamina - Mariehamn 2/10
- Mäntsälä 6/10
- Mänttä-Vilppula 2/10
- Mäntyharju 2/10
- Marttila 7/10
- Masku 6/10
- Merijärvi 10/10
- Merikarvia 10/10
- Miehikkälä 9/10
- Mikkeli 1/10
- Muhos 1/10
- Multia 9/10
- Muonio 10/10
- Mustasaari 10/10
- Muurame 6/10
- Mynämäki 4/10
- Myrskylä 8/10
- Naantali 5/10
- Nakkila 5/10
- Närpiö 9/10
- Nivala 7/10
- Nokia 2/10
- Nousiainen 8/10
- Nurmes 5/10
- Nurmijärvi 5/10
- Orimattila 5/10
- Oripää 3/10
- Orivesi 3/10
- Oulainen 2/10
- Oulu 2/10
- Outokumpu 3/10
- Padasjoki 7/10
- Paimio 5/10
- Pälkäne 6/10
- Paltamo 3/10
- Parainen 7/10
- Parikkala 8/10
- Parkano 3/10
- Pedersören kunta 10/10
- Pelkosenniemi 9/10
- Pello 8/10
- Perho 9/10
- Petäjävesi 8/10
- Pieksämäki 2/10
- Pielavesi 7/10
- Pietarsaari 2/10
- Pihtipudas 3/10
- Pirkkala 4/10
- Polvijärvi 8/10
- Pomarkku 6/10
- Pori 2/10
- Pornainen 8/10
- Porvoo 3/10
- Posio 7/10
- Pöytyä 7/10
- Pudasjärvi 3/10
- Pukkila 9/10
- Punkalaidun 9/10
- Puolanka 1/10
- Puumala 4/10
- Pyhäjärvi 5/10
- Pyhäjoki 5/10
- Pyhäntä 10/10
- Pyhäranta 10/10
- Pyhtää 4/10
- Raahe 2/10
- Rääkkylä 4/10
- Raasepori 3/10
- Raisio 1/10
- Rantasalmi 8/10
- Ranua 9/10
- Rauma 3/10
- Rautalampi 5/10
- Rautavaara 3/10
- Rautjärvi 4/10
- Reisjärvi 9/10
- Riihimäki 2/10
- Ristijärvi 8/10
- Rovaniemi 3/10
- Ruokolahti 9/10
- Ruovesi 3/10
- Rusko 8/10
- Saarijärvi 5/10
- Säkylä 6/10
- Salla 9/10
- Salo 4/10
- Saltvik 9/10
- Sastamala 7/10
- Sauvo 8/10
- Savitaipale 9/10
- Savonlinna 4/10
- Savukoski 10/10
- Seinäjoki 2/10
- Sievi 8/10
- Siikainen 10/10
- Siikajoki 8/10
- Siikalatva 6/10
- Siilinjärvi 4/10
- Simo 10/10
- Sipoo 6/10
- Siuntio 4/10
- Sodankylä 7/10
- Soini 8/10
- Somero 1/10
- Sonkajärvi 7/10
- Sotkamo 4/10
- Sottunga 10/10
- Sulkava 8/10
- Sund 10/10
- Suomussalmi 5/10
- Suonenjoki 2/10
- Sysmä 8/10
- Taipalsaari 7/10
- Taivalkoski 7/10
- Taivassalo 8/10
- Tammela 10/10
- Tampere 1/10
- Tervo 4/10
- Tervola 3/10
- Teuva 10/10
- Tohmajärvi 7/10
- Toholampi 7/10
- Toivakka 4/10
- Tornio 2/10
- Turku 1/10
- Tuusniemi 1/10
- Tuusula 4/10
- Tyrnävä 9/10
- Ulvila 3/10
- Urjala 3/10
- Utajärvi 8/10
- Utsjoki 3/10
- Uurainen 5/10
- Uusikaarlepyy 10/10
- Uusikaupunki 2/10
- Vaala 5/10
- Vaasa 3/10
- Valkeakoski 4/10
- Vantaa 1/10
- Vårdö 6/10
- Varkaus 1/10
- Vehmaa 6/10
- Vesanto 10/10
- Vesilahti 6/10
- Veteli 7/10
- Vieremä 3/10
- Vihti 1/10
- Viitasaari 7/10
- Vimpeli 10/10
- Virolahti 6/10
- Virrat 4/10
- Vöyri 9/10
- Ylitornio 9/10
- Ylivieska 4/10
- Ylöjärvi 5/10
- Ypäjä 7/10
Crime recorded by the police (2024)
| Crime | Recorded | Per 100,000 |
|---|---|---|
| Intentional homicide | 100 | 1.8 |
| Attempted intentional homicide | 381 | 6.8 |
| Serious assault | 1,656 | 29.6 |
| Kidnapping | 0 | 0 |
| Sexual violence | 7,947 | 141.8 |
| of which: Rape | 2,984 | 53.3 |
| of which: Sexual assault | 4,963 | 88.6 |
| Sexual exploitation | 1,695 | 30.3 |
| Robbery | 2,592 | 46.3 |
| Burglary | 6,210 | 110.8 |
| of which: Burglary of homes | 4,144 | 74 |
| Theft | 127,600 | 2,277 |
| of which: Theft of vehicles or parts | 4,975 | 88.8 |
| Drug offences | 25,642 | 457.6 |
| Fraud | 70,983 | 1,266.7 |
| Corruption | 7,097 | 126.7 |
| of which: Bribery | 56 | 1 |
| Money laundering | 1,423 | 25.4 |
| Attacks on computer systems | 2,340 | 41.8 |
| Taking part in an organised crime group | 2 | 0 |
| Environmental pollution (2023) | 412 | 7.4 |
| Illegal waste movement or dumping (2023) | 151 | 2.7 |
| Depletion of natural resources (2023) | 257 | 4.6 |
Each country defines and records crime in its own way, so these figures compare a country with itself over time better than with other countries.
Homicides per 100,000 people by year
| Year | Per 100,000 |
|---|---|
| 2023 | 1 |
| 2022 | 1.2 |
| 2021 | 1.3 |
| 2020 | 1.8 |
| 2019 | 1.5 |
| 2018 | 1.6 |
| 2017 | 1.2 |
| 2016 | 1.3 |
| 2015 | 1.5 |
| 2014 | 1.6 |
| 2013 | 1.6 |
| 2012 | 1.6 |
| 2011 | 2 |
| 2010 | 2.2 |
| 2009 | 2.2 |
| 2008 | 2.5 |
| 2007 | 2.4 |
| 2006 | 2.3 |
| 2005 | 2.3 |
| 2004 | 2.8 |
| 2003 | 2 |
| 2002 | 2.5 |
| 2001 | 3 |
| 2000 | 2.9 |