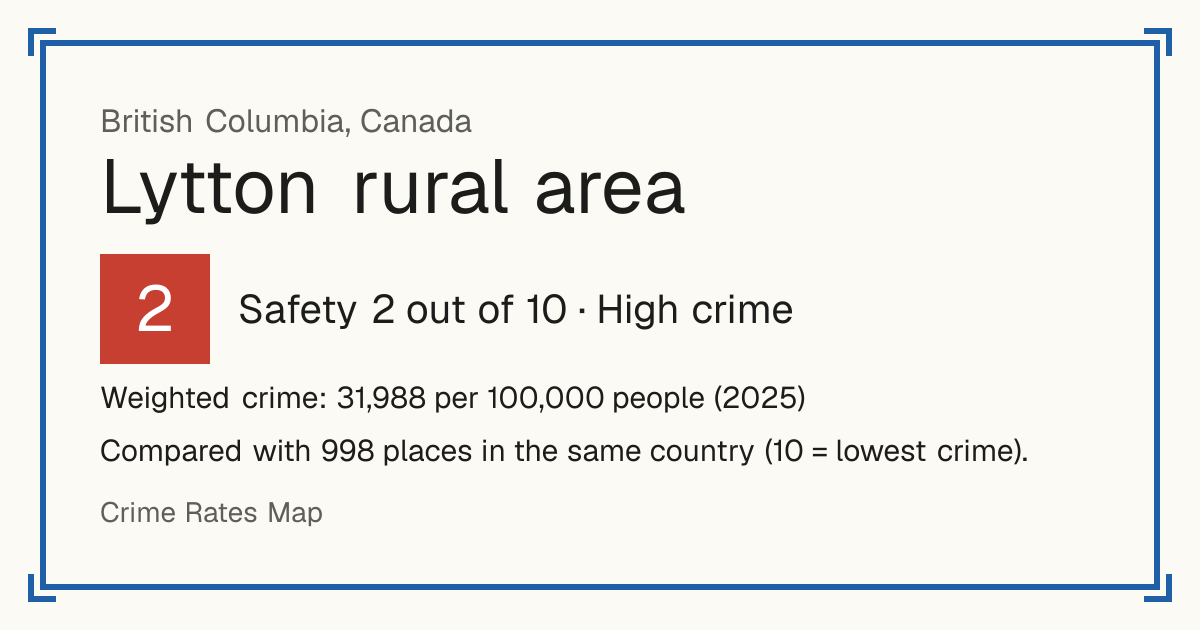
2Lytton rural area
Lytton rural area, Canada: crime rate and Safety score
Safety 2 out of 10 High crime
2/10 in Canada · 3/10 in the world
Compared with 998 places in the same country (10 = lowest crime). 41 places were left out of the comparison (incomplete figures or very few residents).
Weighted crime: 31,988 per 100,000 people (2025)
Crime by type, as recorded by Statistics Canada (2025)
| Type | Count | Per 100,000 a year | All places this source covers |
|---|---|---|---|
| Homicide | |||
| Homicide | 0 | 0 | 1.6 |
| Sexual offences | |||
| Aggravated sexual assault (level 3) | 0 | 0 | 0.3 |
| Sexual assault with a weapon or bodily harm (level 2) | 0 | 0 | 2.1 |
| Sexual assault (level 1) | 3 | 178 | 86.4 |
| Violence | |||
| Aggravated assault (level 3) | 0 | 0 | 9.7 |
| Assault with a weapon or bodily harm (level 2) | 6 | 356.1 | 212.3 |
| Common assault (level 1) | 35 | 2,077.2 | 522.3 |
| Robbery | |||
| Robbery | 1 | 59.3 | 55.1 |
| Theft and burglary | |||
| Breaking and entering | 5 | 296.7 | 261.8 |
| Motor vehicle theft | 1 | 59.3 | 200.3 |
| Theft over $5,000 (not vehicles) | 1 | 59.3 | 60.9 |
| Theft of $5,000 or less (not vehicles) | 6 | 356.1 | 1,305.3 |
| Drugs | |||
| Drug violations | 1 | 59.3 | 141.8 |
| Like every row here: Statistics Canada counts each incident by its most serious violation. | |||
| Damage and public order | |||
| Mischief (property damage) | 33 | 1,958.5 | 725.1 |
Source: Statistics Canada, updated 28 October 2026.
Recorded crime by type (2025)
| Homicide | 0 |
|---|---|
| Sexual offences | 3 |
| Violence | 41 |
| Robbery | 1 |
| Theft and burglary | 13 |
| Drugs | 1 |
| Damage and public order | 33 |
Questions about crime in Lytton rural area
- Is Lytton rural area safe?
- Lytton rural area: Safety 2 out of 10 (High crime). Compared with 998 places in the same country (10 = lowest crime). 41 places were left out of the comparison (incomplete figures or very few residents).
- What is the crime rate in Lytton rural area?
- Lytton rural area: Weighted crime: 31,988 per 100,000 people (2025).
- How many murders are there in Lytton rural area?
- Recorded homicides in Lytton rural area (2025): 0.
Other places nearby
- Merritt 1/10
- Pemberton rural area 7/10
- Hope 2/10
- Whistler 5/10
- Kamloops 2/10
- Princeton rural area 3/10
- Chilliwack 3/10
- Chilliwack rural area 3/10