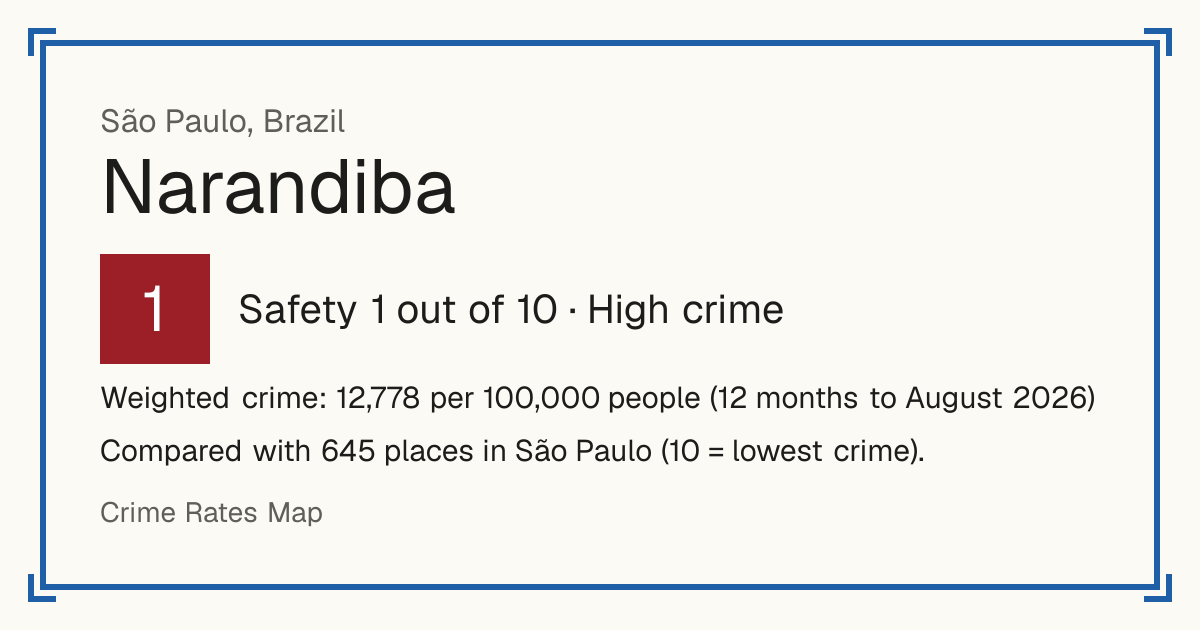
1Narandiba
Narandiba, Brazil: crime rate and Safety score
Safety 1 out of 10 High crime
1/10 in São Paulo · 1/10 in the world
Compared with 645 places in São Paulo (10 = lowest crime).
Weighted crime: 12,778 per 100,000 people (12 months to August 2026)
Crime by type, as recorded by SSP-SP (12 months to August 2026)
| Type | Count | Per 100,000 a year | All places this source covers |
|---|---|---|---|
| Homicide | |||
| Intentional homicide | 1 | 17.5 | 5.2 |
| Counted in cases, not victims. | |||
| Robbery resulting in death | 0 | 0 | 0.2 |
| Assault resulting in death | 0 | 0 | 0.2 |
| Sexual offences | |||
| Rape | 1 | 17.5 | 7.8 |
| Rape of a vulnerable person | 1 | 17.5 | 26 |
| Victims under 14 or unable to resist, as Brazilian law defines it. | |||
| Violence | |||
| Attempted homicide | 1 | 17.5 | 8.4 |
| Attempts only. | |||
| Assault causing injury | 51 | 892.7 | 393.9 |
| Robbery | |||
| Robbery (other) | 0 | 0 | 312.5 |
| Vehicle robbery | 0 | 0 | 43.2 |
| Cargo robbery | 0 | 0 | 6.2 |
| Theft and burglary | |||
| Theft (other) | 35 | 612.6 | 1,179.7 |
| Vehicle theft | 0 | 0 | 185 |
| Drugs | |||
| Drug possession | 0 | 0 | 30.9 |
| Drug trafficking | 0 | 0 | 107.4 |
Source: SSP-SP, updated 26 October 2026.
Recorded crime by type (12 months to August 2026)
| Homicide | 1 |
|---|---|
| Sexual offences | 2 |
| Violence | 52 |
| Robbery | 0 |
| Theft and burglary | 35 |
| Drugs | 0 |