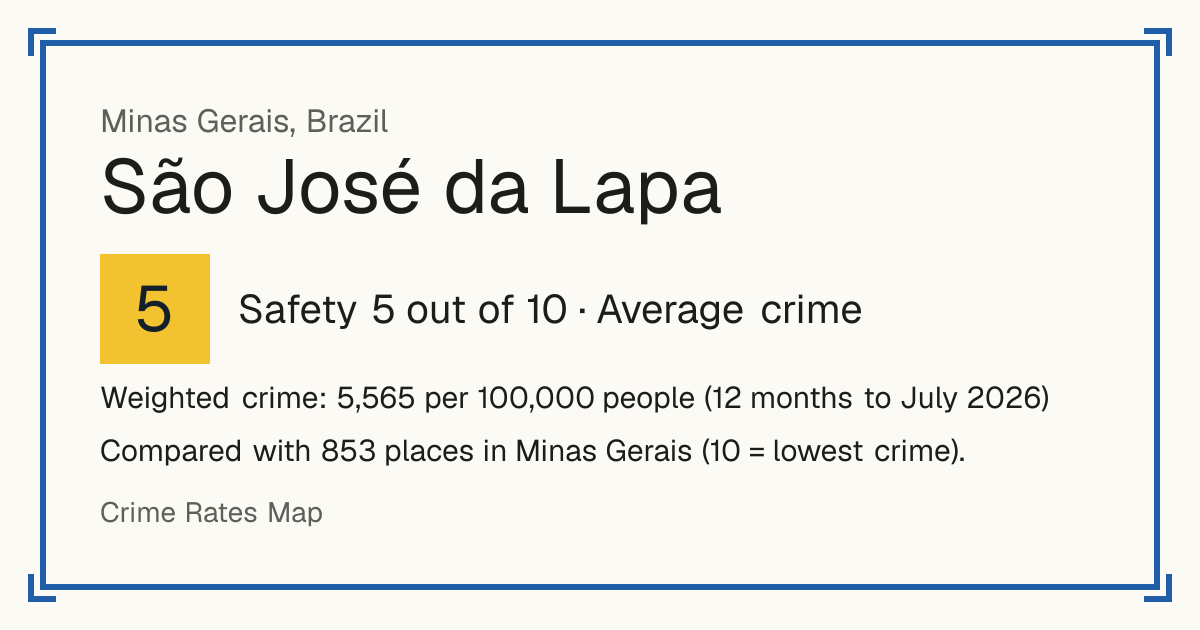
5São José da Lapa
São José da Lapa, Brazil: crime rate and Safety score
Safety 5 out of 10 Average crime
5/10 in Minas Gerais · 1/10 in the world
Compared with 853 places in Minas Gerais (10 = lowest crime).
Weighted crime: 5,565 per 100,000 people (12 months to July 2026)
Crime by type, as recorded by SEJUSP-MG (12 months to July 2026)
| Type | Count | Per 100,000 a year | All places this source covers |
|---|---|---|---|
| Homicide | |||
| Homicide | 2 | 7.7 | 10 |
| Counted in cases, not victims; femicides are a line of their own. | |||
| Femicide | 0 | 0 | 0.5 |
| Counted in cases, not victims. | |||
| Sexual offences | |||
| Rape | 3 | 11.5 | 6.6 |
| Rape of a vulnerable person | 6 | 23 | 18.1 |
| Victims under 14 or unable to resist, as Brazilian law defines it. | |||
| Violence | |||
| Attempted homicide | 4 | 15.3 | 10 |
| Attempts only. | |||
| Attempted femicide | 1 | 3.8 | 0.8 |
| Attempts only. | |||
| Assault causing injury | 57 | 218.5 | 295.6 |
| Kidnapping and false imprisonment | 3 | 11.5 | 1.4 |
| Kidnapping for ransom | 0 | 0 | 0.2 |
| Robbery | |||
| Robbery | 14 | 53.7 | 52.3 |
| Extortion | 2 | 7.7 | 6 |
| Theft and burglary | |||
| Theft | 147 | 563.4 | 913.2 |
Source: SEJUSP-MG, updated 29 October 2026.
Recorded crime by type (12 months to July 2026)
| Homicide | 2 |
|---|---|
| Sexual offences | 9 |
| Violence | 65 |
| Robbery | 16 |
| Theft and burglary | 147 |
Questions about crime in São José da Lapa
- Is São José da Lapa safe?
- São José da Lapa: Safety 5 out of 10 (Average crime). Compared with 853 places in Minas Gerais (10 = lowest crime).
- What is the crime rate in São José da Lapa?
- São José da Lapa: Weighted crime: 5,565 per 100,000 people (12 months to July 2026).
- How many murders are there in São José da Lapa?
- Recorded homicides in São José da Lapa (12 months to July 2026): 2.