1Liège
Liège, Belgium: crime rate and Safety score
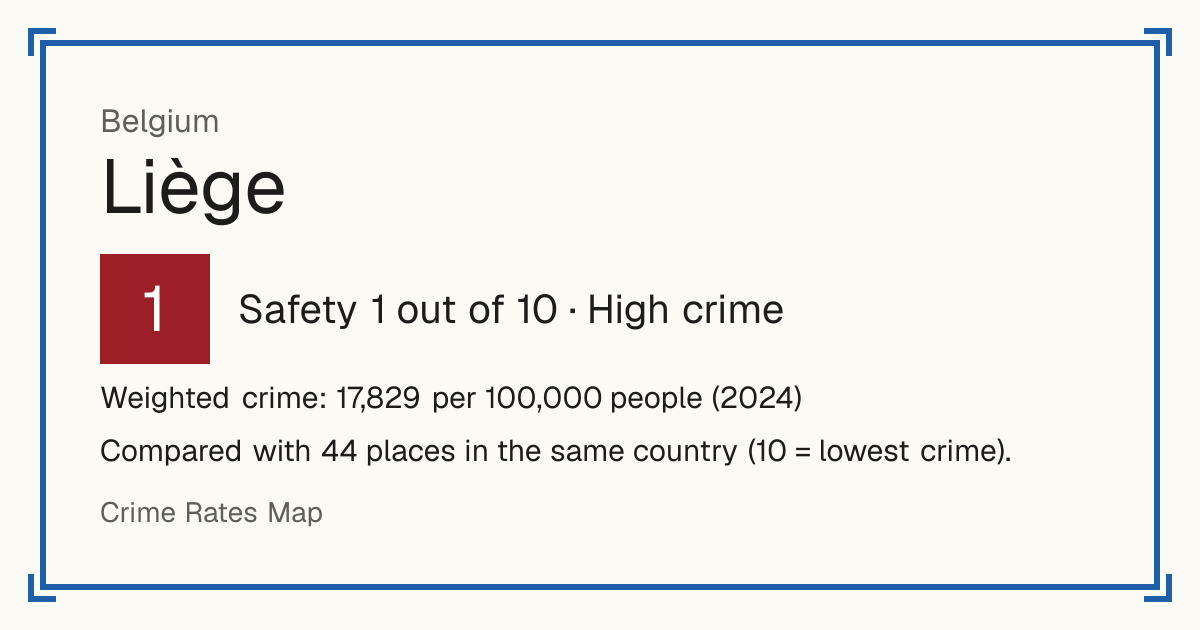
Safety 1 out of 10 High crime
1/10 in Belgium · 6/10 in the world
Compared with 44 places in the same country (10 = lowest crime).
Weighted crime: 17,829 per 100,000 people (2024)
Crime by type, as recorded by Eurostat / national police (2024)
| Type | Count | Per 100,000 a year | All places this source covers |
|---|---|---|---|
| Homicide | |||
| Intentional homicide | 10 | 1.6 | 1.8 |
| Violence | |||
| Assault | 5,937 | 936.7 | 416.4 |
| Robbery | |||
| Robbery | 1,653 | 260.8 | 24 |
| Theft and burglary | |||
| Burglary of homes | 3,776 | 595.8 | 67.4 |
| Other burglary | 889 | 140.3 | 78.8 |
| Motor vehicle theft | 691 | 109 | 20.3 |
| Other theft | 14,348 | 2,263.8 | 322.3 |
Source: Eurostat / national police, updated 26 October 2026.
Recorded crime by type (2024)
| Homicide | 10 |
|---|---|
| Violence | 5,937 |
| Robbery | 1,653 |
| Theft and burglary | 19,704 |