BEBelgium
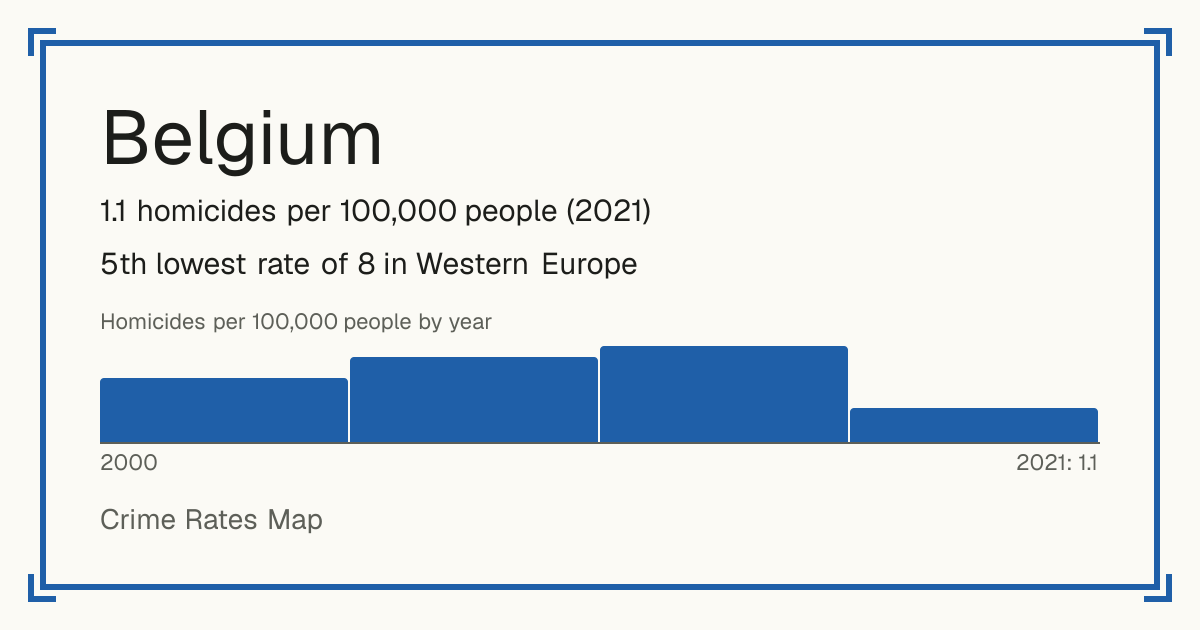
Belgium: crime, homicide rate and trend
- 1.1 homicides per 100,000 people (2021)
- 5th lowest rate of 8 in Western Europe
- World median: 3.8 per 100,000
- Source: World Bank, from UNODC, 2021.
Safety 7 out of 10 compared with the world
Living
7/10 Living 7 out of 10: the average of the places in it, on their scale.
Raw score 8.0 out of 10, before ranking.
Places in Belgium
- Aalst 7/10
- Antwerpen 2/10
- Arlon 4/10
- Ath 6/10
- Bastogne 4/10
- Brugge 5/10
- Brussels-Capital 1/10
- Charleroi 1/10
- Dendermonde 8/10
- Diksmuide 10/10
- Dinant 7/10
- Eeklo 6/10
- Gent 2/10
- Halle-Vilvoorde 9/10
- Hasselt 8/10
- Huy 3/10
- Ieper 10/10
- Kortrijk 6/10
- La Louvière 3/10
- Leuven 8/10
- Liège 1/10
- Maaseik 10/10
- Marche-en-Famenne 2/10
- Mechelen 8/10
- Mons 1/10
- Namur 3/10
- Neufchâteau 3/10
- Nivelles 6/10
- Oostende 5/10
- Oudenaarde 9/10
- Philippeville 4/10
- Roeselare 7/10
- Sint-Niklaas 6/10
- Soignies 5/10
- Thuin 4/10
- Tielt 10/10
- Tongeren 9/10
- Tournai-Mouscron 2/10
- Turnhout 9/10
- Verviers (French-speaking) 3/10
- Verviers (German-speaking Community) 10/10
- Veurne 5/10
- Virton 8/10
- Waremme 7/10
Crime recorded by the police (2024)
| Crime | Recorded | Per 100,000 |
|---|---|---|
| Intentional homicide | 166 | 1.4 |
| Attempted intentional homicide | 1,295 | 11 |
| Serious assault | 67,759 | 573.4 |
| Sexual violence | 12,409 | 105 |
| of which: Rape | 4,792 | 40.6 |
| of which: Sexual assault | 7,617 | 64.5 |
| Sexual exploitation | 2,410 | 20.4 |
| Robbery | 13,747 | 116.3 |
| Burglary | 48,107 | 407.1 |
| of which: Burglary of homes | 36,815 | 311.5 |
| Theft | 195,924 | 1,658 |
| of which: Theft of vehicles or parts | 11,156 | 94.4 |
| Drug offences | 60,152 | 509 |
| Fraud | 123,126 | 1,041.9 |
| Corruption | 4,561 | 38.6 |
| of which: Bribery | 64 | 0.5 |
| Money laundering | 4,897 | 41.4 |
| Attacks on computer systems | 9,891 | 83.7 |
| Taking part in an organised crime group | 386 | 3.3 |
| Environmental pollution (2023) | 482 | 4.1 |
| Illegal waste movement or dumping (2023) | 1,574 | 13.4 |
| Trade in protected species (2023) | 225 | 1.9 |
| Depletion of natural resources (2023) | 115 | 1 |
Each country defines and records crime in its own way, so these figures compare a country with itself over time better than with other countries.
Homicides per 100,000 people by year
| Year | Per 100,000 |
|---|---|
| 2021 | 1.1 |
| 2002 | 3.1 |
| 2001 | 2.7 |
| 2000 | 2.1 |