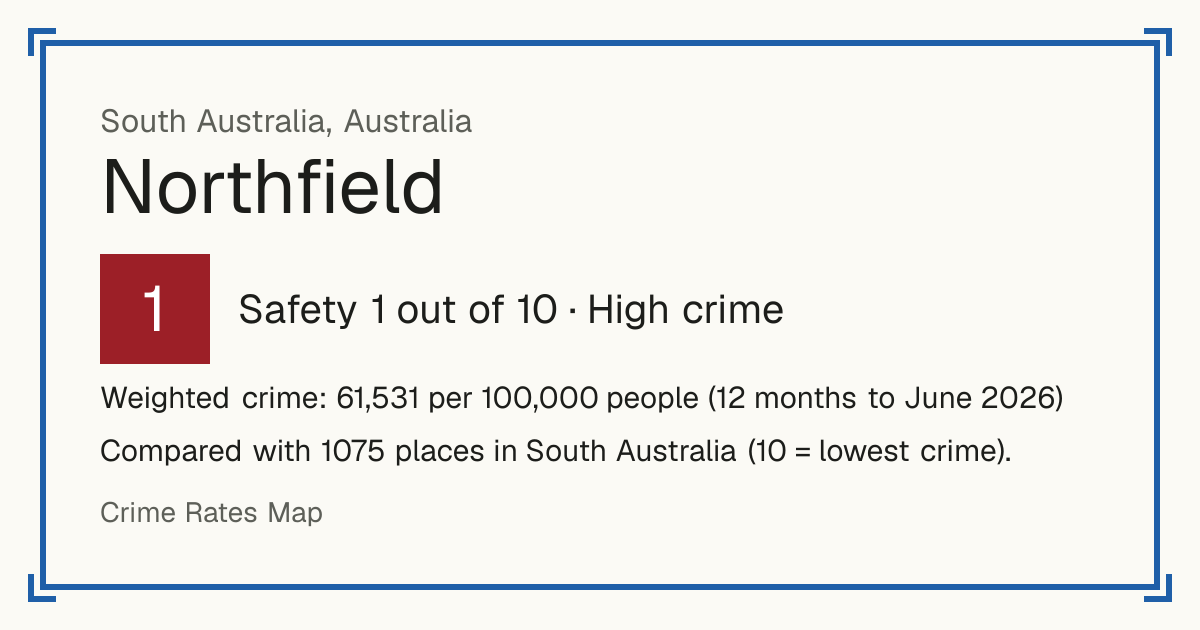
1Northfield
Northfield, Australia: crime rate and Safety score
Safety 1 out of 10 High crime
1/10 in South Australia · 5/10 in the world
Compared with 1075 places in South Australia (10 = lowest crime). 85 places were left out of the comparison (incomplete figures or very few residents).
Weighted crime: 61,531 per 100,000 people (12 months to June 2026)
Residents: 5,043
How accurate: not enough history to test this score yet.
Crime by type, as recorded by South Australia Police (12 months to June 2026)
| Type | Count | Per 100,000 a year | All places this source covers |
|---|---|---|---|
| Homicide | |||
| Homicide | 1 | 19.8 | 2.6 |
| Includes attempted murder and driving causing death. | |||
| Violence | |||
| Assault | 244 | 4,838.4 | 1,359.4 |
| Threats, harassment and other harm | 11 | 218.1 | 160.1 |
| Robbery | |||
| Robbery and extortion | 3 | 59.5 | 37.5 |
| Theft and burglary | |||
| Burglary and unlawful entry | 53 | 1,051 | 718 |
| Theft, including vehicles | 123 | 2,439 | 2,817.3 |
| Damage and public order | |||
| Property damage, including arson | 63 | 1,249.3 | 1,251.7 |
| Other | |||
| Fraud | 14 | 277.6 | 229.5 |
Source: South Australia Police, updated 26 October 2026.
Recorded crime by type (12 months to June 2026)
| Homicide | 1 |
|---|---|
| Violence | 255 |
| Robbery | 3 |
| Theft and burglary | 176 |
| Damage and public order | 63 |
| Other | 14 |