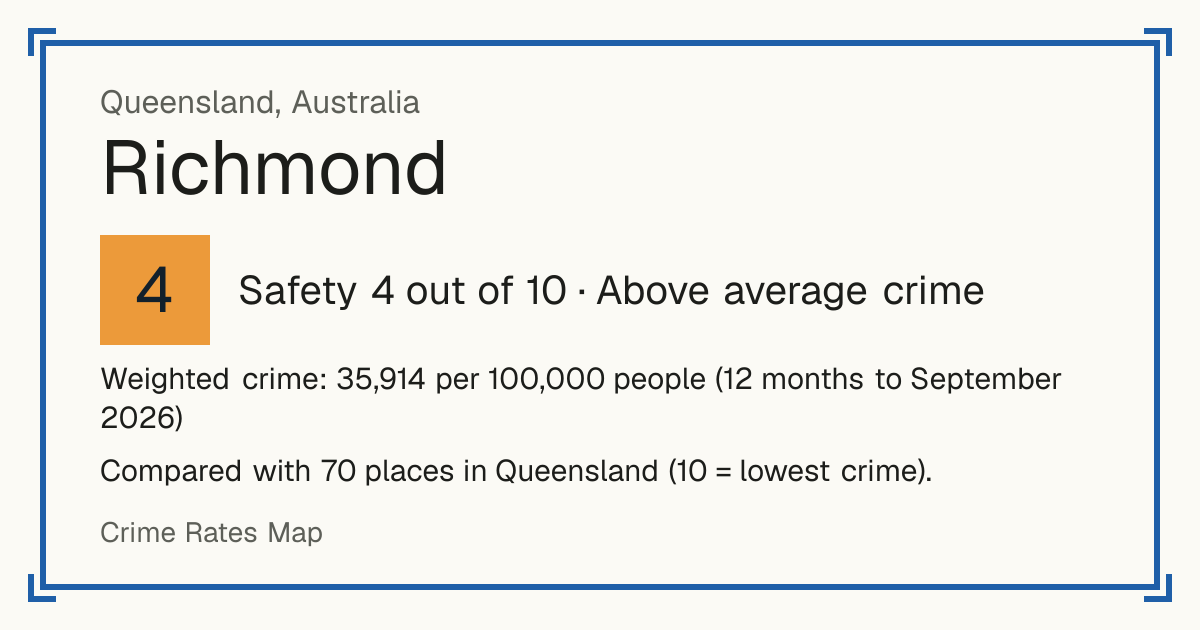
4Richmond
Richmond, Queensland, Australia: crime rate and Safety score
Safety 4 out of 10 Above average crime
4/10 in Queensland · 7/10 in the world
Compared with 70 places in Queensland (10 = lowest crime). 8 places were left out of the comparison (incomplete figures or very few residents).
Weighted crime: 35,914 per 100,000 people (12 months to September 2026)
Crime by type, as recorded by Queensland Police Service (12 months to September 2026)
| Type | Count | Per 100,000 a year | All places this source covers |
|---|---|---|---|
| Homicide | |||
| Murder | 0 | 0 | 0.6 |
| Other homicide | 0 | 0 | 1.5 |
| Includes attempted murder, conspiracy to murder and manslaughter. | |||
| Sexual offences | |||
| Sexual offences | 0 | 0 | 217.2 |
| Violence | |||
| Assault | 22 | 2,791.9 | 1,055.4 |
| Robbery | |||
| Robbery | 0 | 0 | 44.5 |
| Theft and burglary | |||
| Break-in | 2 | 253.8 | 666.7 |
| Unlawful use of a motor vehicle | 0 | 0 | 337.7 |
| Other theft | 5 | 634.5 | 2,665.9 |
| Drugs | |||
| Drug offences | 15 | 1,903.6 | 1,736.5 |
| Damage and public order | |||
| Property damage | 3 | 380.7 | 727.8 |
| Public order offences | 16 | 2,030.5 | 789.5 |
Source: Queensland Police Service, updated 28 October 2026.
Recorded crime by type (12 months to September 2026)
| Homicide | 0 |
|---|---|
| Sexual offences | 0 |
| Violence | 22 |
| Robbery | 0 |
| Theft and burglary | 7 |
| Drugs | 15 |
| Damage and public order | 19 |
Other places nearby
- Charters Towers 4/10
- Tablelands 7/10
- Hinchinbrook 6/10
- Mareeba 3/10
- Townsville 3/10
- Mount Isa 1/10
- Cassowary Coast 5/10
- Burdekin 7/10