8Brisbane
Brisbane, Australia: crime rate and Safety score
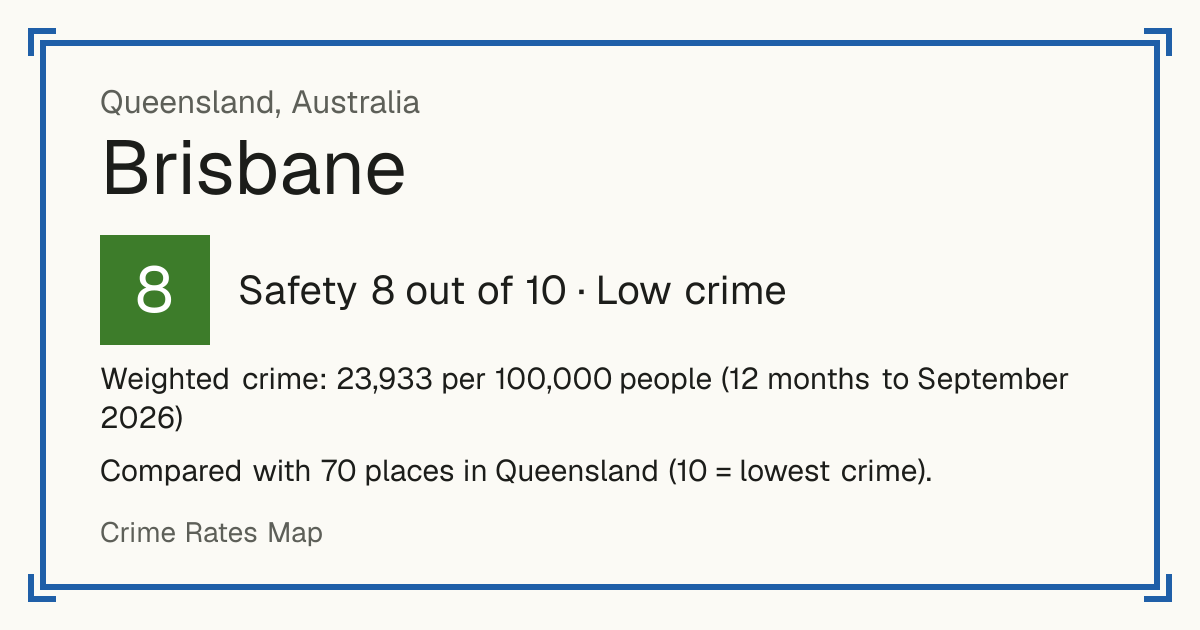
Safety 8 out of 10 Low crime
8/10 in Queensland · 8/10 in the world
Compared with 70 places in Queensland (10 = lowest crime). 8 places were left out of the comparison (incomplete figures or very few residents).
Weighted crime: 23,933 per 100,000 people (12 months to September 2026)
Crime by type, as recorded by Queensland Police Service (12 months to September 2026)
| Type | Count | Per 100,000 a year | All places this source covers |
|---|---|---|---|
| Homicide | |||
| Murder | 2 | 0.1 | 0.6 |
| Other homicide | 16 | 1.2 | 1.5 |
| Includes attempted murder, conspiracy to murder and manslaughter. | |||
| Sexual offences | |||
| Sexual offences | 2,245 | 163.2 | 217.2 |
| Violence | |||
| Assault | 9,888 | 719 | 1,055.4 |
| Robbery | |||
| Robbery | 754 | 54.8 | 44.5 |
| Theft and burglary | |||
| Break-in | 9,540 | 693.7 | 666.7 |
| Unlawful use of a motor vehicle | 4,951 | 360 | 337.7 |
| Other theft | 42,860 | 3,116.4 | 2,665.9 |
| Drugs | |||
| Drug offences | 22,518 | 1,637.3 | 1,736.5 |
| Damage and public order | |||
| Property damage | 7,439 | 540.9 | 727.8 |
| Public order offences | 10,361 | 753.4 | 789.5 |
Source: Queensland Police Service, updated 25 October 2026.
Recorded crime by type (12 months to September 2026)
| Homicide | 18 |
|---|---|
| Sexual offences | 2,245 |
| Violence | 9,888 |
| Robbery | 754 |
| Theft and burglary | 57,351 |
| Drugs | 22,518 |
| Damage and public order | 17,800 |
Other places nearby
- Redland 10/10
- Logan 5/10
- Moreton Bay 9/10
- Ipswich 6/10
- Gold Coast 8/10
- Scenic Rim 10/10
- Somerset 9/10
- Lockyer Valley 5/10