Crime Rates Map

Rate Crime Rates Map

How useful is the site?

Sent by email to the person who runs the site. Please leave out personal details.

LN9Postcode district

LN9 crime rate and crime map

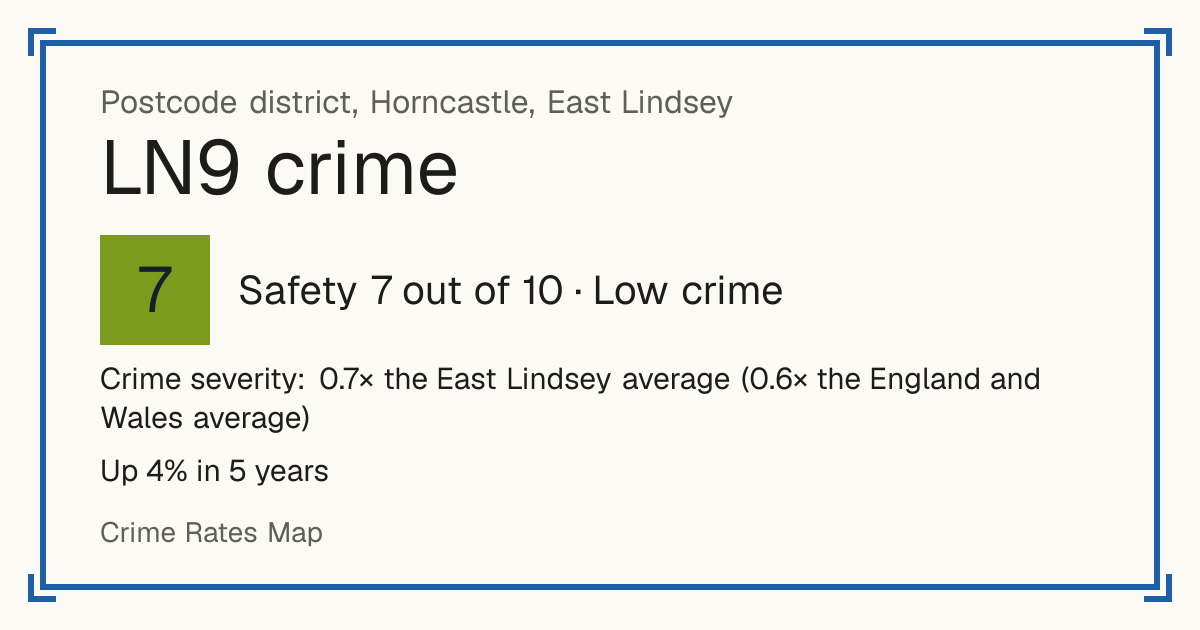
Recorded crime in LN9 is 0.7 times the East Lindsey average and 0.6 times the England and Wales average. Over 5 years it has risen 4%. Most of the harm comes from violence and sexual offences (assaults, harassment, sexual offences). Police data to August 2026.

Horncastle, East Lindsey. 10,871 residents in 6 neighbourhoods.

Safety in the UK
7/10Low crime
Safety in the world
8/10Low crime
Living
4.0/10Weak
5-year change
+4%more crimes
vs the council
0.7×the East Lindsey average
Open on the map

Safety and Living

Safety

Crime severity: 0.7× the East Lindsey average (0.6× the England and Wales average)

Crime only, by how serious it is. Compared with every postcode district. Higher is safer.

Living

Based on schools, transport, health, supermarkets, weighted by importance. Crime is not part of it. Higher is better.

Neighbourhoods by Safety

Tested: 79% of scores were within 1 point of what happened next. How we test

East Lindsey 011A: Safety 5 out of 10, average crimeEast Lindsey 011B: Safety 8 out of 10, low crimeEast Lindsey 011C: Safety 9 out of 10, very low crimeEast Lindsey 011D: Safety 4 out of 10, above average crimeEast Lindsey 007B: Safety 8 out of 10, low crimeEast Lindsey 009D: Safety 8 out of 10, low crime
1 = least safe, 10 = safest. Grey: no score. Select a neighbourhood to open it on the map.

Crime over 5 years

Up 4% in 5 years Recorded crimes in LN9, anti-social behaviour left out.

Sep 2021 – Aug 2022: 532 crimesSep 2021 – Aug 2022532Sep 2022 – Aug 2023: 539 crimesSep 2022 – Aug 2023539Sep 2023 – Aug 2024: 485 crimesSep 2023 – Aug 2024485Sep 2024 – Aug 2025: 452 crimesSep 2024 – Aug 2025452Sep 2025 – Aug 2026: 553 crimesSep 2025 – Aug 2026553

What is recorded

Crime severity: 0.7× the East Lindsey average (0.6× the England and Wales average). 47 recorded crimes per 1,000 residents a year.

  • Violence and sexual offences (assaults, harassment, sexual offences): 59% of the harm here
  • Burglary: 23% of the harm here
  • Other theft: 4% of the harm here

Anti-social behaviour: 15 incidents per 1,000 residents a year, not scored. Not a crime, so it is not part of the Safety score.

Shops, transport, schools and health

Distances are straight-line, not walking routes. Scores use fixed distance bands, so they do not depend on other districts. Higher is better.

Supermarkets

Poor accessScore 2 out of 10
  • Typical distance to a large supermarket: 21.9 km.
  • Co-op Louth (The Co-operative Group), 21.4 km from the district centre
  • Asda Boston Superstore (Asda), 27.3 km from the district centre
  • Tesco Boston Superstore (Tesco), 27.4 km from the district centre

Transport

Limited accessScore 3 out of 10
  • Typical number of bus stops within 400 m: 4.
  • Nearest railway station: Hubberts Bridge Rail Station, 26.2 km from the district centre
  • Nearest tram or metro stop: Peterborough (Nene Valley Railway), 73.1 km from the district centre

Schools

Fair schools nearbyScore 5 out of 10

Primary schools within 2 km

  • Horncastle Primary School: Good (graded inspection, 2024), 370 m away

Secondary schools within 2 km

  • The Banovallum School: Good (ungraded inspection, 2023), 190 m away
  • Queen Elizabeth's Grammar School, Horncastle: Good (graded inspection, 2024), 670 m away

    Health

    Fair accessScore 5 out of 10
    • Nearest GP surgery: HORNCASTLE MEDICAL GROUP, 820 m from the district centre, CQC rating: Good, rated 2016
    • Nearest hospital with A&E: Pilgrim Hospital, 27.0 km from the district centre

    Crime by type

    Recorded crimes per 1,000 residents per year, most serious first, not counting anti-social behaviour.

    TypePer 1,000 a year
    Robbery0.3
    Burglary4.9
    Violence and sexual offences (assaults, harassment, sexual offences)19.4
    Drugs1.5
    Possession of weapons (knives and other weapons)0.5
    Other crime1.2
    Other theft4.1
    Theft from the person (pickpocketing, bag snatching)0.1
    Vehicle crime (cars stolen and broken into)2.2
    Criminal damage and arson (vandalism)6.7
    Public order3.5
    Bicycle theft0.3
    Shoplifting2.6

    How often crimes lead to a charge

    In LN9, 6% of crimes reported between September 2024 and August 2025 led to someone being charged or summonsed (England and Wales: 9%).

    Violence and sexual offences: 6% chargedCharged or summonsed: 6%Caution or other action: 9%Suspect found, not prosecuted: 73%No suspect identified: 9%Still open: 3%Criminal damage and arson: 0% chargedCaution or other action: 5%Suspect found, not prosecuted: 35%No suspect identified: 59%Still open: 2%
    Show as a table
    TypeCrimesCharged or summonsedCaution or other actionSuspect found, not prosecutedNo suspect identifiedStill open
    Violence and sexual offences (assaults, harassment, sexual offences)2256%9%73%9%3%
    Criminal damage and arson (vandalism)630%5%35%59%2%

    Uses the latest outcome police have recorded so far. 2% of these crimes are still open, so the final figures may be a little higher.

    Trend over the years

    Crime severity per resident (sentence-days of the crimes recorded each year). Hatched bars are years with fewer than twelve months of data for most residents.

    20165.420175.820188.2201911.6202011.9202110.5202211.0202310.920248.420259.7202610.5

    Last 12 months: 10.8 against a 10-year average of 9.7, 12% higher.

    Recorded crime in LN9 is 0.7 times the East Lindsey average and 0.6 times the England and Wales average. Over 5 years it has risen 4%. Most of the harm comes from violence and sexual offences (assaults, harassment, sexual offences). Police data to August 2026.
    These figures as an image, for sharing.

    Questions about crime in LN9

    Is LN9 a safe place to live?
    LN9 scores 7 out of 10 for safety (low crime), compared with every postcode district in England, Wales and Northern Ireland. Crime severity is 0.7 times the East Lindsey average.
    Is crime going up or down in LN9?
    Up 4% over 5 years, from 532 recorded crimes a year to 553.
    What is the most common crime in LN9?
    The most common recorded crime is violence and sexual offences (assaults, harassment, sexual offences), about 19 per 1,000 residents a year.
    How does crime in LN9 compare with East Lindsey?
    Crime severity in LN9 is 0.7 times the East Lindsey average.
    How often does crime lead to a charge in LN9?
    In LN9, 6% of crimes reported between September 2024 and August 2025 led to someone being charged or summonsed (England and Wales: 9%). 31% were closed without a suspect being identified.

    Towns

    Council: East Lindsey

    Other LN postcode districts

    Every UK postcode district