Crime Rates Map

Rate Crime Rates Map

How useful is the site?

Sent by email to the person who runs the site. Please leave out personal details.

BL11Postcode district

BL11 crime rate and crime map

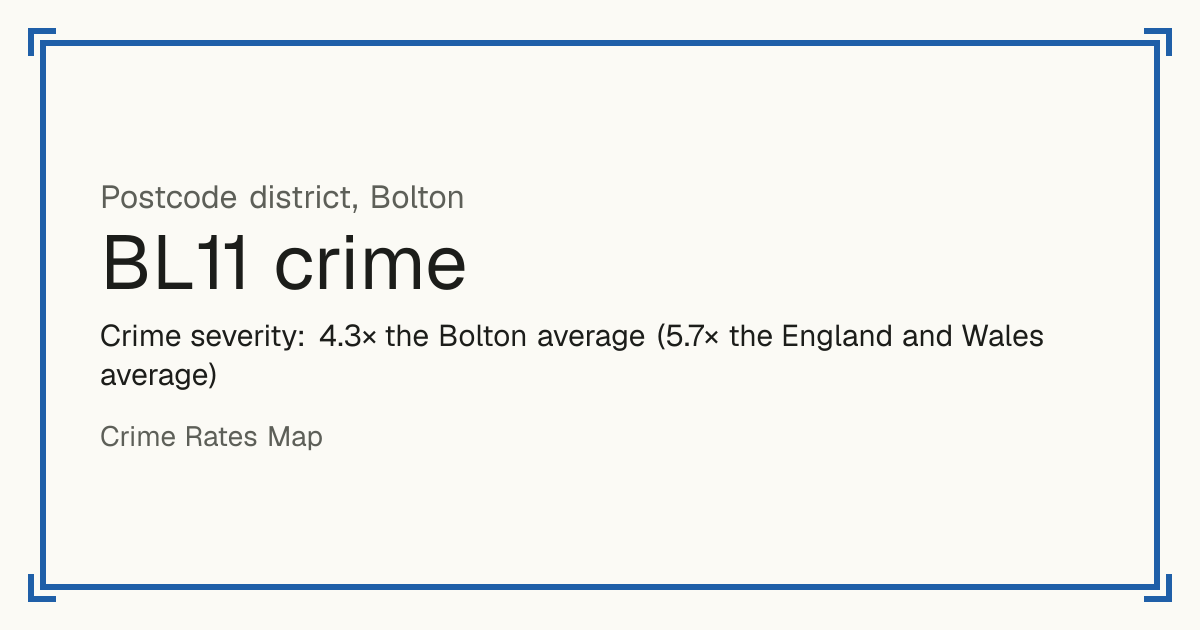
BL11 is mostly a busy town or city centre, so it has no Safety score: crime is counted per resident and few people live there. Recorded crime in BL11 is 4.3 times the Bolton average and 5.7 times the England and Wales average. The police force here stopped publishing data after June 2019. Most of the harm comes from violence and sexual offences (assaults, harassment, sexual offences).

Bolton. 394 residents in 1 neighbourhoods.

Safety
-Busy centre, not scored
Living
8.3/10Good
vs the council
4.3×the Bolton average
Open on the map

Crime in Bolton now

The police force here has published no street-level crime for BL11 since June 2019, so the map and scores below are from before then. These are the latest Home Office figures for the whole council area, April 2025 to March 2026.

93.2 crimes per 1,000 residents were recorded in Bolton in 2025/26 (England and Wales: 83.2).

Greater Manchester Police did not assign 5.9% of the crimes it recorded in 2025/26 to a council area, so these figures are lower than the true count.

Recorded crimes by type, 2025/26
TypeCrimes in 2025/26Per 1,000 residentsChange on 2024/25
Cars stolen5061.6Down 13%
Cars broken into6782.2Down 3%
Vehicle tampering1750.56Down 14%
Vandalism to homes8392.7Down 17%
Vandalism to other buildings3211.0Down 6%
Vandalism to vehicles6742.2Down 5%
Arson1400.45Down 15%
Burglary of homes6812.2Down 25%
Burglary of businesses2870.93Down 7%
Homicide (murder and manslaughter)1--
Carrying a knife or blade2460.79About the same
Carrying other weapons (including guns)2410.78Up 12%
Robbery of people2760.89Down 24%
Robbery of businesses1270.41Up 81%
Violence with injury2,7258.8Down 3%
Violence without injury5,29217.1Down 5%
Stalking and harassment4,55414.7Down 5%
Sexual offences1,0513.4Down 7%
Shoplifting1,4594.7Down 35%
Bicycle theft1290.42Up 4%
Theft from the person (pickpocketing, bag snatching)1490.48Down 29%
Drug dealing7082.3Up 8%
Drug possession9833.2Up 46%

Under 10 a year: no rate or change, the numbers are too small to compare. These are council-area figures: police.uk street-level data, used for the map and the Safety score, only has the broad categories, and no source publishes murders or stabbings by street. Source: Home Office, police recorded crime by community safety partnership.

Greater Manchester Police area: 2,831 offences involving a knife or sharp instrument in 2025/26 (3,425 the year before). This covers the whole police force area, not only Bolton.

Source: Home Office, police recorded knife crime by police force.

Crime in Bolton

Safety and Living

Safety

Crime severity: 4.3× the Bolton average (5.7× the England and Wales average)

Busy city or town centre. Crime is recorded where it happens but measured per resident, and few people live in a centre while many come to shop, work and go out. So crime per resident here looks many times higher than the risk to someone living here, and much of it is theft from shops and from people out and about. That is why it gets no Safety score: compared with residential areas the number would mislead. The crime figures shown are still the real recorded crime.

Living

Based on schools, transport, health, supermarkets, weighted by importance. Crime is not part of it. Higher is better.

Neighbourhoods by Safety

Bolton 016D: no score
1 = least safe, 10 = safest. Grey: no score. Select a neighbourhood to open it on the map.

1 neighbourhood has no population figure, so it is not scored.

Shops, transport, schools and health

Distances are straight-line, not walking routes. Scores use fixed distance bands, so they do not depend on other districts. Higher is better.

Supermarkets

Excellent accessScore 10 out of 10
  • Typical distance to a large supermarket: 150 m.
  • Sainsburys Bolton (Sainsburys), 150 m from the district centre
  • Morrisons Bolton (Morrisons), 400 m from the district centre
  • Asda Burnden Park Superstore (Asda), 1.3 km from the district centre

Transport

Excellent accessScore 10 out of 10
  • Typical number of bus stops within 400 m: 10.
  • Nearest railway station: Bolton Rail Station, 510 m from the district centre
  • Nearest tram or metro stop: Radcliffe (Manchester Metrolink), 12.1 km from the district centre

Schools

Good schools nearbyScore 7 out of 10

Primary schools within 2 km

  • St Peter and St Paul RC Primary School a Voluntary Academy: Good (ungraded inspection of the predecessor school, 2020), 510 m away
  • Bishop Bridgeman CofE Primary School: Good (graded inspection, 2022), 790 m away
  • Ss Simon & Jude CofE Primary School, Bolton: Good (graded inspection, 2024), 1.2 km away
  • St William of York Roman Catholic Primary School: Good (ungraded inspection, 2023), 1.2 km away
  • Pikes Lane Primary School: Outstanding (ungraded inspection, 2023), 1.7 km away

Secondary schools within 2 km

  • Mount St Joseph RC High School a Voluntary Academy: Requires improvement (graded inspection of the predecessor school, 2023), 2.0 km away

    Health

    Good accessScore 7 out of 10
    • Nearest GP surgery: BOLTON MEDICAL CENTRE, 680 m from the district centre, CQC rating: Good
    • Nearest hospital with A&E: Fairfield Hospital, 19.6 km from the district centre
    BL11 is mostly a busy town or city centre, so it has no Safety score: crime is counted per resident and few people live there. Recorded crime in BL11 is 4.3 times the Bolton average and 5.7 times the England and Wales average. The police force here stopped publishing data after June 2019. Most of the harm comes from violence and sexual offences (assaults, harassment, sexual offences).
    These figures as an image, for sharing.

    Questions about crime in BL11

    Is BL11 a safe place to live?
    BL11 has no Safety score: it is mostly a busy town or city centre, where crime is counted per resident and few people live. See the figures on this page for what is recorded. Police data here stops in June 2019.
    What is the most common crime in BL11?
    The most common recorded crime is violence and sexual offences (assaults, harassment, sexual offences), about 150 per 1,000 residents a year. Police data here stops in June 2019.
    How does crime in BL11 compare with Bolton?
    Crime severity in BL11 is 4.3 times the Bolton average. Police data here stops in June 2019.

    Nearest town

    Council: Bolton

    Other BL postcode districts

    Every UK postcode district

    Town-centre neighbourhoods

    Few people live in these areas but many shop, work and go out there, so crime per resident looks far higher than the risk to someone living there. They have no Safety score, because compared with residential areas the number would mislead; their crime figures are still shown.