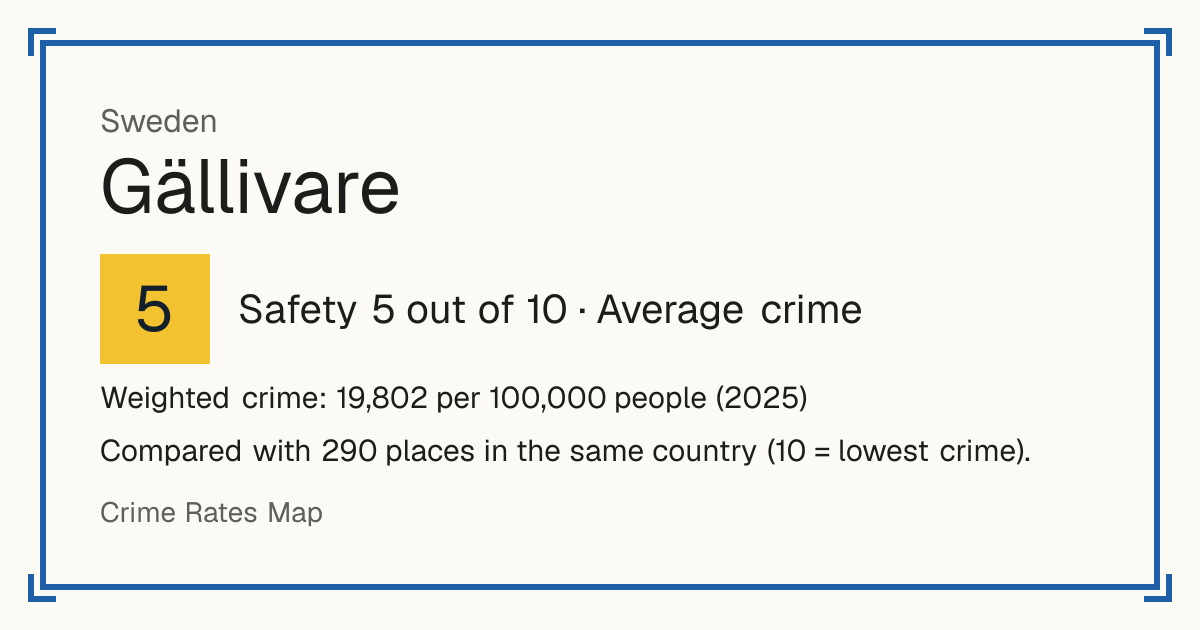
5Gällivare
Gällivare, Sweden: crime rate and Safety score
Safety 5 out of 10 Average crime
5/10 in Sweden · 7/10 in the world
Compared with 290 places in the same country (10 = lowest crime).
Weighted crime: 19,802 per 100,000 people (2025)
Crime by type, as recorded by Brå (2025)
| Type | Count | Per 100,000 a year | All places this source covers |
|---|---|---|---|
| Sexual offences | |||
| Sexual offences | 37 | 215.9 | 205.1 |
| Violence | |||
| Attempted murder or manslaughter | 1 | 5.8 | 9.6 |
| Attempts only: completed homicides are not published by kommun. | |||
| Assault, including aggravated | 159 | 927.9 | 827.4 |
| Robbery | |||
| Robbery, including aggravated | 3 | 17.5 | 32.4 |
| Theft and burglary | |||
| Home burglary | 37 | 215.9 | 476.4 |
| Vehicle theft | 21 | 122.6 | 86.6 |
| Bicycle theft | 30 | 175.1 | 540.8 |
| Other theft | 186 | 1,085.5 | 1,462.3 |
| Drugs | |||
| Drug offences | 96 | 560.3 | 1,090.6 |
| Damage and public order | |||
| Criminal damage | 96 | 560.3 | 1,602.1 |
| Public order offences | 7 | 40.9 | 61.3 |
| Other | |||
| Fraud and dishonesty | 186 | 1,085.5 | 1,864.5 |
Source: Brå, updated 26 October 2026.
Recorded crime by type (2025)
| Sexual offences | 37 |
|---|---|
| Violence | 160 |
| Robbery | 3 |
| Theft and burglary | 274 |
| Drugs | 96 |
| Damage and public order | 103 |
| Other | 186 |