Bollebygd, Sweden: crime rate and Safety score
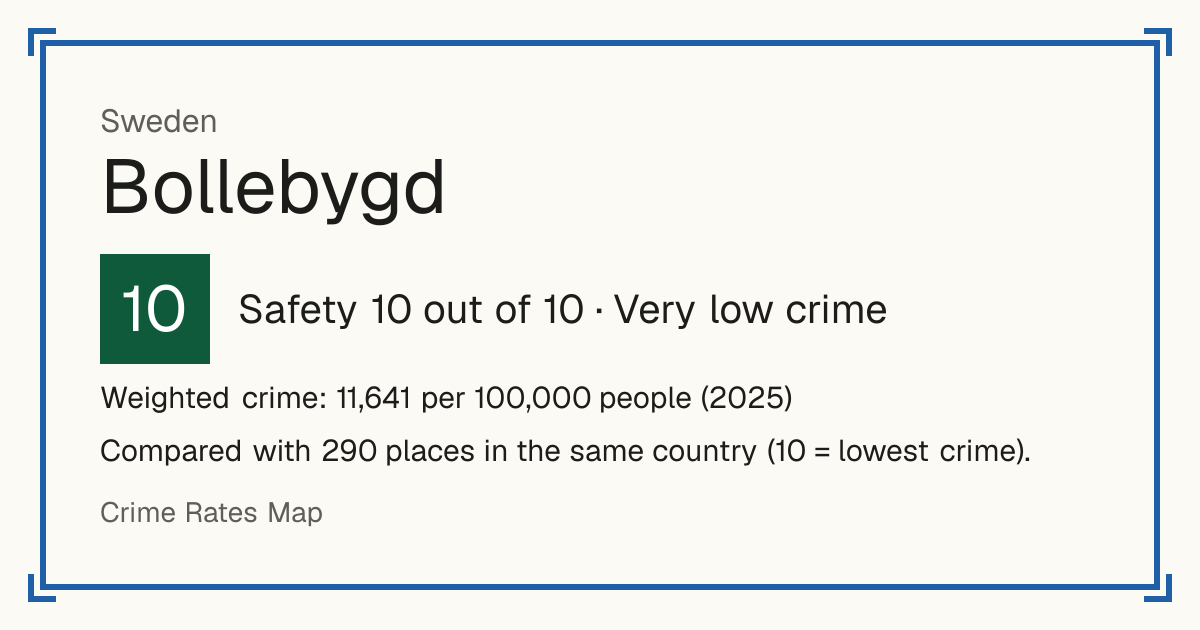
Safety 10 out of 10 Very low crime
10/10 in Sweden · 8/10 in the world
Compared with 290 places in the same country (10 = lowest crime).
Weighted crime: 11,641 per 100,000 people (2025)
Crime by type, as recorded by Brå (2025)
| Type | Count | Per 100,000 a year | All places this source covers |
|---|---|---|---|
| Sexual offences | |||
| Sexual offences | 9 | 92 | 205.1 |
| Violence | |||
| Attempted murder or manslaughter | 0 | 0 | 9.6 |
| Attempts only: completed homicides are not published by kommun. | |||
| Assault, including aggravated | 44 | 449.7 | 827.4 |
| Robbery | |||
| Robbery, including aggravated | 0 | 0 | 32.4 |
| Theft and burglary | |||
| Home burglary | 5 | 51.1 | 476.4 |
| Vehicle theft | 8 | 81.8 | 86.6 |
| Bicycle theft | 8 | 81.8 | 540.8 |
| Other theft | 83 | 848.3 | 1,462.3 |
| Drugs | |||
| Drug offences | 24 | 245.3 | 1,090.6 |
| Damage and public order | |||
| Criminal damage | 85 | 868.8 | 1,602.1 |
| Public order offences | 8 | 81.8 | 61.3 |
| Other | |||
| Fraud and dishonesty | 170 | 1,737.5 | 1,864.5 |
Source: Brå, updated 28 October 2026.
Recorded crime by type (2025)
| Sexual offences | 9 |
|---|---|
| Violence | 44 |
| Robbery | 0 |
| Theft and burglary | 104 |
| Drugs | 24 |
| Damage and public order | 93 |
| Other | 170 |
Questions about crime in Bollebygd
- Is Bollebygd safe?
- Bollebygd: Safety 10 out of 10 (Very low crime). Compared with 290 places in the same country (10 = lowest crime).
- What is the crime rate in Bollebygd?
- Bollebygd: Weighted crime: 11,641 per 100,000 people (2025).
Living
3/10 Living 3 out of 10, compared with other places in the same country.
Raw score 1.7 out of 10, before ranking.
- Schools: 1/10
- Transport: 1/10
- Health: 3/10
- Supermarkets: 2/10
Nearest places
- A&E: Alingsås lasarett 21.3 km
- Supermarket: ICA Nära Hedared 8.6 km
- Supermarket: Godiskällaren 9.2 km
Schools count by distance only: there are no inspection grades to use.
Who governs Bollebygd
Bollebygd: S, V, MP, M (Cross-bloc). Västra Götalandsregionen: S, V, MP (Red-green). 2022–2026 period.
Ulf Rapp · S, V, MP, M (Cross-bloc)
since about October 2022
source: Wikidata
Bollebygd ▲ +5% · Sweden ▲ +4%
Recorded crime per 1,000 people, the year before taking office vs the latest year in office
Michael Plogell · Not known
about October 2018 – October 2022
source: Wikidata
Bollebygd ▲ +7% · Sweden ▼ −2%
Recorded crime per 1,000 people, the year before taking office vs the latest year in office
http://www.wikidata.org/.well-known/genid/b7f1ae8701ae2b60fd34f8eae340dc1e · S, V, MP (Red-green)
about October 2014 – October 2018
source: Wikidata
Bollebygd ▼ −9% · Sweden ▼ −7%
Recorded crime per 1,000 people, the year before taking office vs the latest year in office
C, L, KD, M (Centre-right)
about October 2010 – October 2014
Bollebygd ▲ +7% · Sweden ▼ −1%
Recorded crime per 1,000 people, the year before taking office vs the latest year in office
C, L, KD, M (Centre-right)
about October 2006 – October 2010
Bollebygd ▲ +7% · Sweden ▲ +1%
Recorded crime per 1,000 people, the year before taking office vs the latest year in office
C, L, KD, M (Centre-right)
about October 2002 – October 2006
Bollebygd ▼ −31% · Sweden ▼ −1%
Recorded crime per 1,000 people, the year before taking office vs the latest year in office
Governing parties per mandate period: SCB (Det politiska styret). S Social Democrats, V Left, MP Greens, C Centre, L Liberals, KD Christian Democrats, M Moderates, SD Sweden Democrats; “+ 2” = two other parties, mostly local. For periods up to 2010–2014 SCB asked for the governing majority, from 2014–2018 for the parties in the political leadership. Dates are approximate (the new council meets in October after the election). Names of the municipal board chair: Wikidata, only where one person held it for the whole period. Crime: Brå, reported offences; residents: SCB.