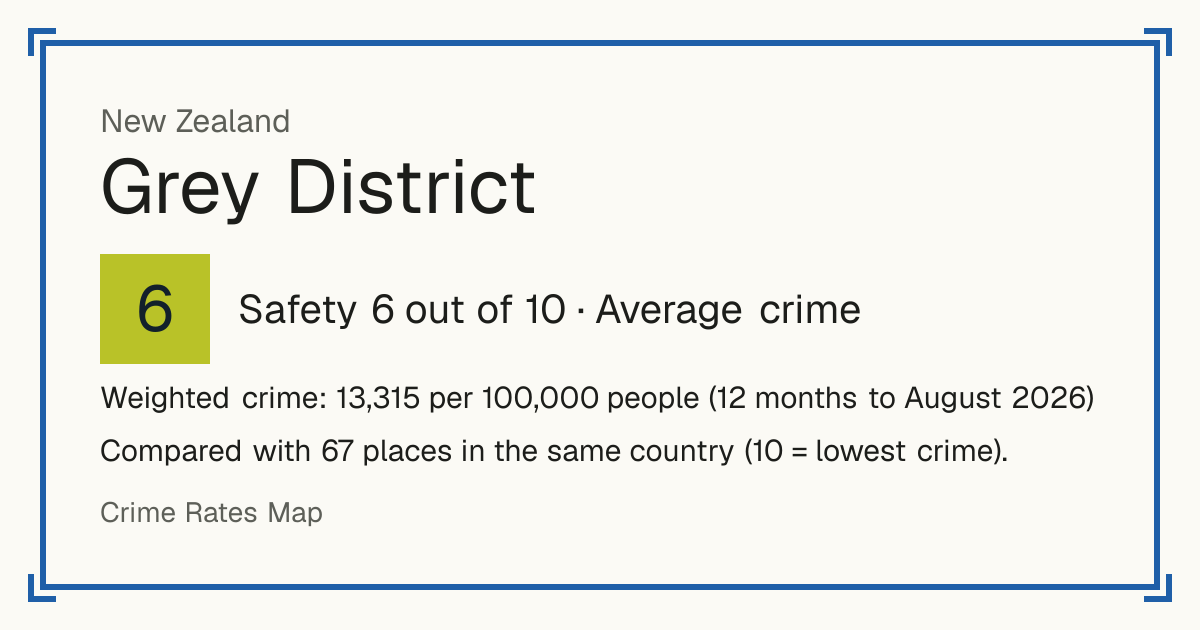
6Grey District
Grey District, New Zealand: crime rate and Safety score
Safety 6 out of 10 Average crime
6/10 in New Zealand · 7/10 in the world
Compared with 67 places in the same country (10 = lowest crime).
Weighted crime: 13,315 per 100,000 people (12 months to August 2026)
Crime by type, as recorded by New Zealand Police (12 months to August 2026)
| Type | Count | Per 100,000 a year | All places this source covers |
|---|---|---|---|
| Sexual offences | |||
| Sexual offences | 16 | 109.6 | 73.9 |
| Violence | |||
| Assault | 73 | 500 | 609 |
| Abduction and kidnapping | 0 | 0 | 4.3 |
| Robbery | |||
| Robbery, blackmail and extortion | 8 | 54.8 | 74.1 |
| Theft and burglary | |||
| Burglary | 119 | 815.1 | 1,108.2 |
| Vehicle theft | 49 | 335.6 | 637.5 |
| Includes taking a vehicle for use without the owner's consent. | |||
| Shoplifting | 108 | 739.7 | 1,561.9 |
| Other theft | 139 | 952.1 | 1,343 |
| All thefts less vehicle theft and shoplifting. | |||
Source: New Zealand Police, updated 28 October 2026.
Recorded crime by type (12 months to August 2026)
| Sexual offences | 16 |
|---|---|
| Violence | 73 |
| Robbery | 8 |
| Theft and burglary | 415 |
Other places nearby
- Buller District 6/10
- Selwyn District 10/10
- Hurunui District 9/10
- Waimakariri District 8/10
- Ashburton District 9/10
- Timaru District 8/10
- Christchurch City 1/10
- Tasman District 9/10