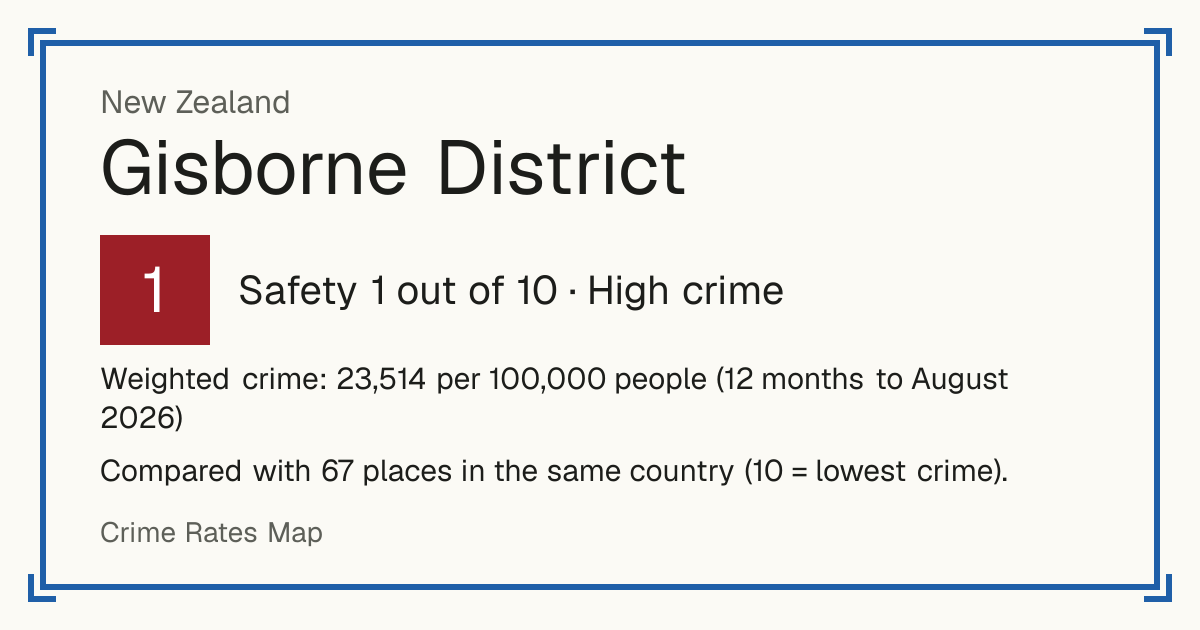
1Gisborne District
Gisborne District, New Zealand: crime rate and Safety score
Safety 1 out of 10 High crime
1/10 in New Zealand · 6/10 in the world
Compared with 67 places in the same country (10 = lowest crime).
Weighted crime: 23,514 per 100,000 people (12 months to August 2026)
Crime by type, as recorded by New Zealand Police (12 months to August 2026)
| Type | Count | Per 100,000 a year | All places this source covers |
|---|---|---|---|
| Sexual offences | |||
| Sexual offences | 54 | 102.5 | 73.9 |
| Violence | |||
| Assault | 506 | 960.2 | 609 |
| Abduction and kidnapping | 7 | 13.3 | 4.3 |
| Robbery | |||
| Robbery, blackmail and extortion | 47 | 89.2 | 74.1 |
| Theft and burglary | |||
| Burglary | 1,019 | 1,933.6 | 1,108.2 |
| Vehicle theft | 538 | 1,020.9 | 637.5 |
| Includes taking a vehicle for use without the owner's consent. | |||
| Shoplifting | 729 | 1,383.3 | 1,561.9 |
| Other theft | 617 | 1,170.8 | 1,343 |
| All thefts less vehicle theft and shoplifting. | |||
Source: New Zealand Police, updated 26 October 2026.
Recorded crime by type (12 months to August 2026)
| Sexual offences | 54 |
|---|---|
| Violence | 513 |
| Robbery | 47 |
| Theft and burglary | 2,903 |
Other places nearby
- Ōpōtiki District 2/10
- Whakatane District 2/10
- Wairoa District 3/10
- Kawerau District 2/10
- Rotorua District 1/10
- Tauranga City 3/10
- Napier City 1/10
- Hastings District 3/10