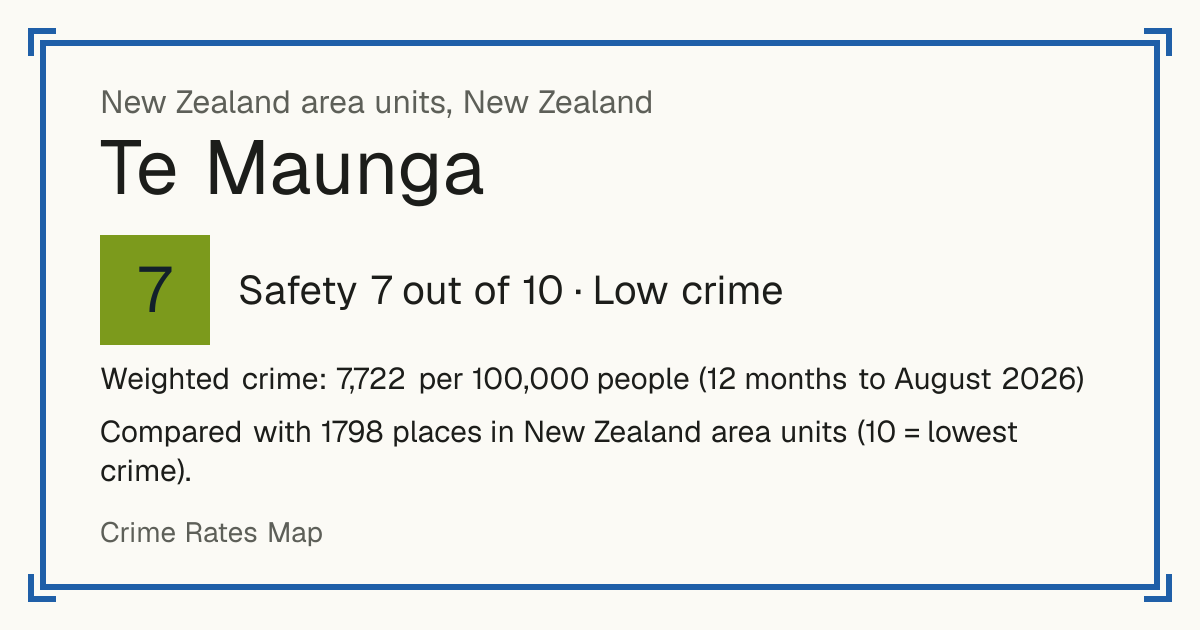
7Te Maunga
Te Maunga, New Zealand: crime rate and Safety score
Safety 7 out of 10 Low crime
7/10 in New Zealand area units · 7/10 in the world
Compared with 1798 places in New Zealand area units (10 = lowest crime). 60 places were left out of the comparison (incomplete figures or very few residents).
Weighted crime: 7,722 per 100,000 people (12 months to August 2026)
Residents: 6,889
How accurate: not enough history to test this score yet.
Crime by type, as recorded by New Zealand Police (12 months to August 2026)
| Type | Count | Per 100,000 a year | All places this source covers |
|---|---|---|---|
| Sexual offences | |||
| Sexual offences | 5 | 72.6 | 74.3 |
| Violence | |||
| Assault | 20 | 290.3 | 612.7 |
| Abduction and kidnapping | 0 | 0 | 4.3 |
| Robbery | |||
| Robbery, blackmail and extortion | 3 | 43.5 | 74.6 |
| Theft and burglary | |||
| Burglary | 37 | 537.1 | 1,115.2 |
| Vehicle theft | 36 | 522.6 | 641.4 |
| Includes taking a vehicle for use without the owner's consent. | |||
| Shoplifting | 0 | 0 | 1,572.4 |
| Other theft | 31 | 450 | 1,350.9 |
| All thefts less vehicle theft and shoplifting. | |||
Source: New Zealand Police, updated 28 October 2026.
Recorded crime by type (12 months to August 2026)
| Sexual offences | 5 |
|---|---|
| Violence | 20 |
| Robbery | 3 |
| Theft and burglary | 104 |
Questions about crime in Te Maunga
- Is Te Maunga safe?
- Te Maunga: Safety 7 out of 10 (Low crime). Compared with 1798 places in New Zealand area units (10 = lowest crime). 60 places were left out of the comparison (incomplete figures or very few residents).
- What is the crime rate in Te Maunga?
- Te Maunga: Weighted crime: 7,722 per 100,000 people (12 months to August 2026).
Other places nearby
- Arataki 1/10
- Omanu 1/10
- Welcome Bay East 7/10
- Tauranga South 1/10
- Brookfield 5/10
- Hairini 9/10
- Matua 10/10
- Greerton 2/10