LTLithuania
Lithuania: crime, homicide rate and trend
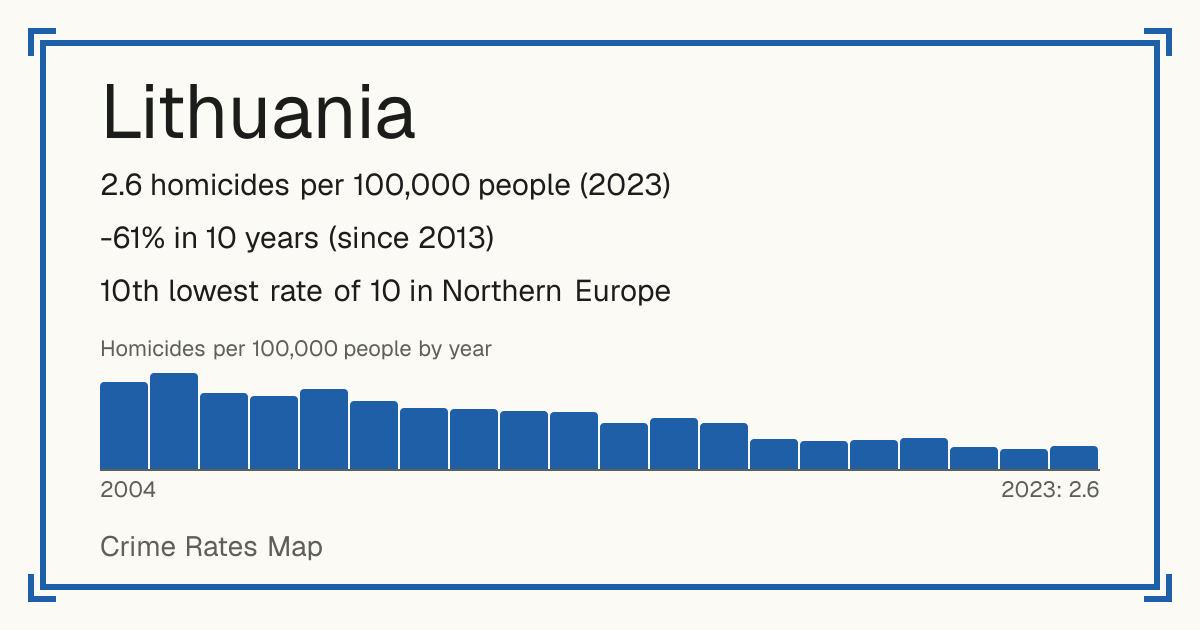
- 2.6 homicides per 100,000 people (2023)
- -61% in 10 years (since 2013)
- 10th lowest rate of 10 in Northern Europe
- World median: 3.8 per 100,000
- Source: World Bank, from UNODC, 2023.
Safety 6 out of 10 compared with the world
Questions about crime in Lithuania
- Is Lithuania safe?
- Lithuania: 2.6 homicides per 100,000 people (2023). 10th lowest rate of 10 in Northern Europe. World median: 3.8 per 100,000. Safety 6 out of 10 compared with the world.
- What is the murder rate in Lithuania?
- Lithuania: 2.6 homicides per 100,000 people (2023). Source: World Bank, from UNODC, 2023.
- Is crime going up in Lithuania?
- The homicide rate is down 61% since 2013: from 6.7 per 100,000 people in 2013 to 2.6 in 2023.
- Which places in Lithuania have the least crime?
- Lowest crime among the 60 municipalities compared: Šilalės rajono savivaldybė (10/10), Kretingos rajono savivaldybė (10/10), Rietavo savivaldybė (10/10). The lists on this page rank them all.
- Which places in Lithuania have the most crime?
- Highest crime among the 60 municipalities compared: Kaišiadorių rajono savivaldybė (1/10), Birštono savivaldybė (1/10), Kėdainių rajono savivaldybė (1/10). The lists on this page rank them all.
Lowest crime places in Lithuania
- Šilalės rajono savivaldybė 10/10
- Kretingos rajono savivaldybė 10/10
- Rietavo savivaldybė 10/10
- Druskininkų savivaldybė 10/10
- Klaipėdos rajono savivaldybė 10/10
- Joniškio rajono savivaldybė 10/10
- Lazdijų rajono savivaldybė 10/10
- Anykščių rajono savivaldybė 9/10
- Mažeikių rajono savivaldybė 9/10
- Ignalinos rajono savivaldybė 9/10
Ranked by crime per 100,000 people among the 60 municipalities compared, with each place's Safety score (1 to 10, 10 = lowest crime).
Highest crime places in Lithuania
- Kaišiadorių rajono savivaldybė 1/10
- Birštono savivaldybė 1/10
- Kėdainių rajono savivaldybė 1/10
- Palangos miesto savivaldybė 1/10
- Biržų rajono savivaldybė 1/10
- Klaipėdos miesto savivaldybė 2/10
- Molėtų rajono savivaldybė 2/10
- Marijampolės savivaldybė 2/10
- Jonavos rajono savivaldybė 2/10
- Vilniaus miesto savivaldybė 2/10
Ranked by crime per 100,000 people among the 60 municipalities compared, with each place's Safety score (1 to 10, 10 = lowest crime).
Living
9/10 Living 9 out of 10: the average of the places in it, on their scale.
Raw score 5.2 out of 10, before ranking.
Places in Lithuania
- Akmenės rajono savivaldybė 6/10
- Alytaus miesto savivaldybė 3/10
- Alytaus rajono savivaldybė 7/10
- Anykščių rajono savivaldybė 9/10
- Birštono savivaldybė 1/10
- Biržų rajono savivaldybė 1/10
- Druskininkų savivaldybė 10/10
- Elektrėnų savivaldybė 4/10
- Ignalinos rajono savivaldybė 9/10
- Jonavos rajono savivaldybė 2/10
- Joniškio rajono savivaldybė 10/10
- Jurbarko rajono savivaldybė 3/10
- Kaišiadorių rajono savivaldybė 1/10
- Kalvarijos savivaldybė 6/10
- Kauno miesto savivaldybė 3/10
- Kauno rajono savivaldybė 9/10
- Kazlų Rūdos savivaldybė 8/10
- Kėdainių rajono savivaldybė 1/10
- Kelmės rajono savivaldybė 6/10
- Klaipėdos miesto savivaldybė 2/10
- Klaipėdos rajono savivaldybė 10/10
- Kretingos rajono savivaldybė 10/10
- Kupiškio rajono savivaldybė 3/10
- Lazdijų rajono savivaldybė 10/10
- Marijampolės savivaldybė 2/10
- Mažeikių rajono savivaldybė 9/10
- Molėtų rajono savivaldybė 2/10
- Neringos savivaldybė 8/10
- Pagėgių savivaldybė 7/10
- Pakruojo rajono savivaldybė 5/10
- Palangos miesto savivaldybė 1/10
- Panevėžio miesto savivaldybė 5/10
- Panevėžio rajono savivaldybė 4/10
- Pasvalio rajono savivaldybė 5/10
- Plungės rajono savivaldybė 3/10
- Prienų rajono savivaldybė 6/10
- Radviliškio rajono savivaldybė 4/10
- Raseinių rajono savivaldybė 9/10
- Rietavo savivaldybė 10/10
- Rokiškio rajono savivaldybė 8/10
- Šakių rajono savivaldybė 7/10
- Šalčininkų rajono savivaldybė 4/10
- Šiaulių miesto savivaldybė 5/10
- Šiaulių rajono savivaldybė 9/10
- Šilalės rajono savivaldybė 10/10
- Šilutės rajono savivaldybė 6/10
- Širvintų rajono savivaldybė 5/10
- Skuodo rajono savivaldybė 3/10
- Švenčionių rajono savivaldybė 8/10
- Tauragės rajono savivaldybė 8/10
- Telšių rajono savivaldybė 6/10
- Trakų rajono savivaldybė 4/10
- Ukmergės rajono savivaldybė 7/10
- Utenos rajono savivaldybė 2/10
- Varėnos rajono savivaldybė 4/10
- Vilkaviškio rajono savivaldybė 7/10
- Vilniaus miesto savivaldybė 2/10
- Vilniaus rajono savivaldybė 7/10
- Visagino savivaldybė 8/10
- Zarasų rajono savivaldybė 5/10
Crime recorded by the police (2024)
| Crime | Recorded | Per 100,000 |
|---|---|---|
| Intentional homicide | 76 | 2.6 |
| Attempted intentional homicide | 16 | 0.6 |
| Serious assault | 135 | 4.7 |
| Kidnapping | 0 | 0 |
| Sexual violence | 167 | 5.8 |
| of which: Rape | 86 | 3 |
| of which: Sexual assault | 81 | 2.8 |
| Sexual exploitation | 490 | 17 |
| Robbery | 336 | 11.6 |
| Burglary | 691 | 23.9 |
| of which: Burglary of homes | 691 | 23.9 |
| Theft | 11,818 | 409.5 |
| of which: Theft of vehicles or parts | 779 | 27 |
| Drug offences | 4,383 | 151.9 |
| Fraud | 4,916 | 170.4 |
| Corruption | 294 | 10.2 |
| of which: Bribery | 80 | 2.8 |
| Money laundering | 78 | 2.7 |
| Attacks on computer systems | 575 | 19.9 |
| Taking part in an organised crime group | 0 | 0 |
| Environmental pollution (2023) | 5 | 0.2 |
| Illegal waste movement or dumping (2023) | 0 | 0 |
| Trade in protected species (2023) | 0 | 0 |
| Depletion of natural resources (2023) | 2 | 0.1 |
Each country defines and records crime in its own way, so these figures compare a country with itself over time better than with other countries.
Homicides per 100,000 people by year
| Year | Per 100,000 |
|---|---|
| 2023 | 2.6 |
| 2022 | 2.4 |
| 2021 | 2.6 |
| 2020 | 3.6 |
| 2019 | 3.4 |
| 2018 | 3.3 |
| 2017 | 3.5 |
| 2016 | 5.3 |
| 2015 | 5.9 |
| 2014 | 5.4 |
| 2013 | 6.7 |
| 2012 | 6.8 |
| 2011 | 7 |
| 2010 | 7.1 |
| 2009 | 8 |
| 2008 | 9.3 |
| 2007 | 8.6 |
| 2006 | 8.8 |
| 2005 | 11.2 |
| 2004 | 10.2 |
| 2002 | 8.5 |
| 2001 | 10.2 |
| 2000 | 10.6 |