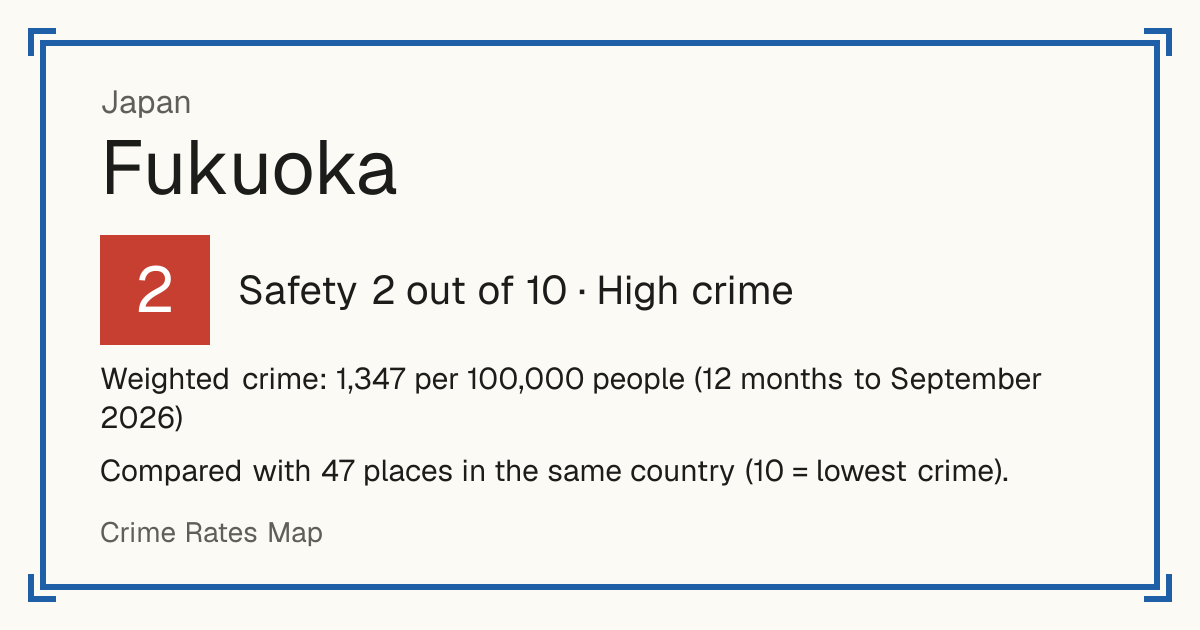
2Fukuoka
Fukuoka, Japan: crime rate and Safety score
Safety 2 out of 10 High crime
2/10 in Japan · 10/10 in the world
Compared with 47 places in the same country (10 = lowest crime).
Weighted crime: 1,347 per 100,000 people (12 months to September 2026)
Crime by type, as recorded by National Police Agency (12 months to September 2026)
| Type | Count | Per 100,000 a year | All places this source covers |
|---|---|---|---|
| Homicide | |||
| Murder | 44 | 0.9 | 0.8 |
| Includes attempts and preparation, as Japan counts them. | |||
| Sexual offences | |||
| Rape (non-consensual intercourse) | 196 | 3.8 | 3.7 |
| Sexual assault (non-consensual indecency) | 243 | 4.8 | 5.9 |
| Robbery | |||
| Robbery | 34 | 0.7 | 1.2 |
| Theft and burglary | |||
| Burglary | 2,065 | 40.6 | 34.8 |
| Homes, shops, offices and other buildings. | |||
| Car theft | 50 | 1 | 3.3 |
| Bag snatching | 18 | 0.4 | 0.3 |
| Pickpocketing | 63 | 1.2 | 1.2 |
| Other theft | 23,812 | 467.6 | 373.5 |
| All thefts minus the four lines above: bicycle and motorbike theft, shoplifting, theft from cars and the rest. | |||
| Damage and public order | |||
| Arson | 33 | 0.6 | 0.6 |
| Criminal damage | 2,536 | 49.8 | 43.3 |
| Other | |||
| Trespass | 525 | 10.3 | 9 |
| Kidnapping and human trafficking | 17 | 0.3 | 0.5 |
| Counted apart from violent crime here, because the prefecture tables give no assault or injury figures. | |||
Source: National Police Agency, updated 26 October 2026.
Recorded crime by type (12 months to September 2026)
| Homicide | 44 |
|---|---|
| Sexual offences | 439 |
| Robbery | 34 |
| Theft and burglary | 26,008 |
| Damage and public order | 2,569 |
| Other | 542 |