HUHungary
Hungary: crime, homicide rate and trend
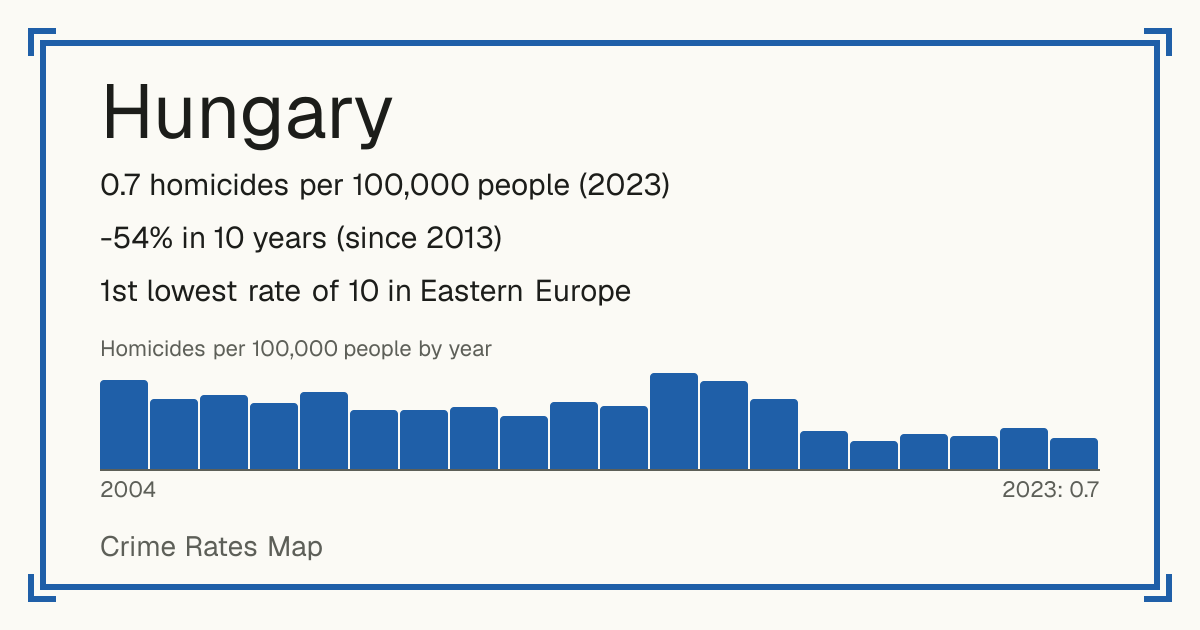
- 0.7 homicides per 100,000 people (2023)
- -54% in 10 years (since 2013)
- 1st lowest rate of 10 in Eastern Europe
- World median: 3.8 per 100,000
- Source: World Bank, from UNODC, 2023.
Safety 8 out of 10 compared with the world
Living
1/10 Living 1 out of 10: the average of the places in it, on their scale.
Raw score 4.8 out of 10, before ranking.
Places in Hungary
Crime recorded by the police (2024)
| Crime | Recorded | Per 100,000 |
|---|---|---|
| Intentional homicide | 66 | 0.7 |
| Attempted intentional homicide | 100 | 1 |
| Kidnapping | 4 | 0 |
| Sexual violence | 489 | 5.1 |
| of which: Rape | 489 | 5.1 |
| Sexual exploitation | 583 | 6.1 |
| Robbery | 665 | 6.9 |
| Theft | 60,346 | 629.6 |
| Drug offences | 6,671 | 69.6 |
| Fraud | 41,753 | 435.6 |
| Corruption | 6,317 | 65.9 |
| of which: Bribery | 3,737 | 39 |
| Money laundering | 1,272 | 13.3 |
| Attacks on computer systems | 18,384 | 191.8 |
| Environmental pollution (2023) | 35 | 0.4 |
| Illegal waste movement or dumping (2023) | 907 | 9.5 |
| Trade in protected species (2023) | 222 | 2.3 |
| Depletion of natural resources (2023) | 182 | 1.9 |
Each country defines and records crime in its own way, so these figures compare a country with itself over time better than with other countries.
Homicides per 100,000 people by year
| Year | Per 100,000 |
|---|---|
| 2023 | 0.7 |
| 2022 | 1 |
| 2021 | 0.8 |
| 2020 | 0.8 |
| 2019 | 0.7 |
| 2018 | 0.9 |
| 2017 | 1.6 |
| 2016 | 2.1 |
| 2015 | 2.2 |
| 2014 | 1.5 |
| 2013 | 1.6 |
| 2012 | 1.3 |
| 2011 | 1.5 |
| 2010 | 1.4 |
| 2009 | 1.4 |
| 2008 | 1.8 |
| 2007 | 1.5 |
| 2006 | 1.7 |
| 2005 | 1.6 |
| 2004 | 2.1 |
| 2003 | 2.3 |
| 2002 | 2 |
| 2001 | 2.5 |
| 2000 | 2 |