ESSpain
Spain: crime, homicide rate and trend
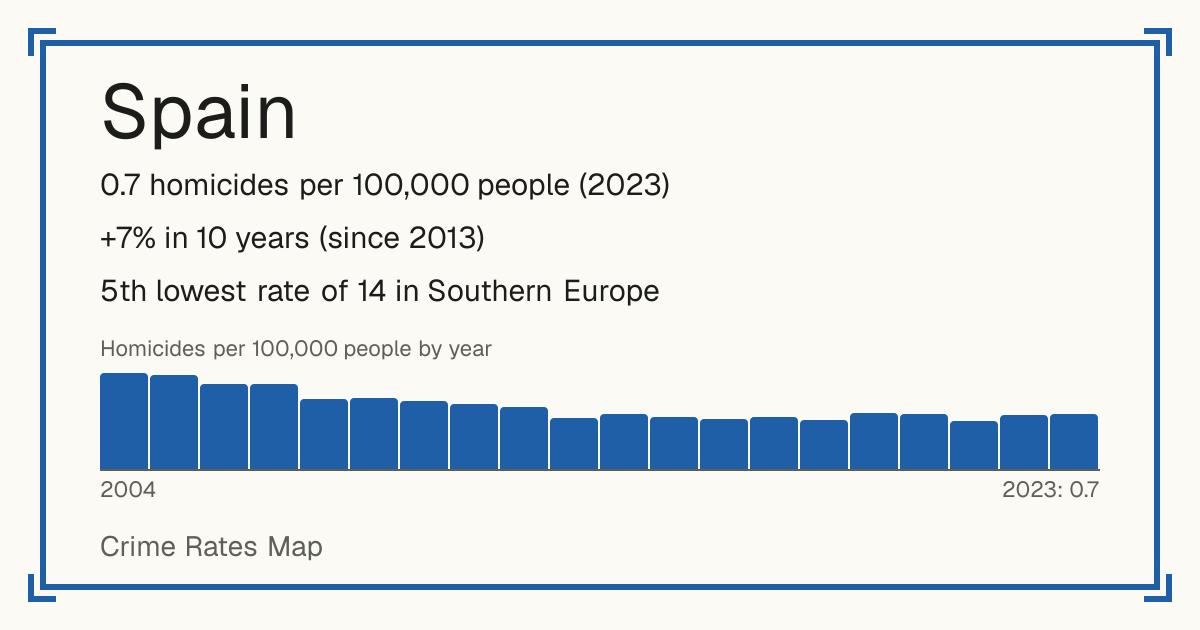
- 0.7 homicides per 100,000 people (2023)
- +7% in 10 years (since 2013)
- 5th lowest rate of 14 in Southern Europe
- World median: 3.8 per 100,000
- Source: World Bank, from UNODC, 2023.
Safety 8 out of 10 compared with the world
Places in Spain
- A Coruña
- Albacete
- Alicante/Alacant
- Almería
- Araba/Álava
- Asturias
- Ávila
- Badajoz
- Barcelona
- Bizkaia
- Burgos
- Cáceres
- Cádiz
- Cantabria
- Castellón/Castelló
- Ciudad Real
- Córdoba
- Cuenca
- Gipuzkoa
- Girona
- Granada
- Guadalajara
- Huelva
- Huesca
- Illes Balears
- Jaén
- La Rioja
- Las Palmas
- León
- Lleida
- Lugo
- Madrid
- Málaga
- Murcia
- Navarra
- Ourense
- Palencia
- Pontevedra
- Salamanca
- Santa Cruz de Tenerife
- Segovia
- Sevilla
- Soria
- Tarragona
- Teruel
- Toledo
- Valencia/València
- Valladolid
- Zamora
- Zaragoza
Crime recorded by the police (2024)
| Crime | Recorded | Per 100,000 |
|---|---|---|
| Intentional homicide | 349 | 0.7 |
| Attempted intentional homicide | 1,343 | 2.8 |
| Serious assault | 28,724 | 59.1 |
| Kidnapping | 104 | 0.2 |
| Sexual violence | 19,655 | 40.4 |
| of which: Rape | 5,222 | 10.7 |
| of which: Sexual assault | 14,433 | 29.7 |
| Sexual exploitation | 3,191 | 6.6 |
| Robbery | 62,976 | 129.5 |
| Burglary | 142,587 | 293.3 |
| of which: Burglary of homes | 81,094 | 166.8 |
| Theft | 219,211 | 450.9 |
| of which: Theft of vehicles or parts | 23,472 | 48.3 |
| Drug offences | 21,540 | 44.3 |
| Fraud | 517,271 | 1,063.9 |
| Corruption | 1,505 | 3.1 |
| of which: Bribery | 87 | 0.2 |
| Money laundering | 808 | 1.7 |
| Attacks on computer systems | 11,690 | 24 |
| Taking part in an organised crime group | 2,726 | 5.6 |
| Environmental pollution (2023) | 122 | 0.3 |
| Illegal waste movement or dumping (2023) | 1 | 0 |
| Trade in protected species (2023) | 414 | 0.9 |
| Depletion of natural resources (2023) | 598 | 1.2 |
Each country defines and records crime in its own way, so these figures compare a country with itself over time better than with other countries.
Homicides per 100,000 people by year
| Year | Per 100,000 |
|---|---|
| 2023 | 0.7 |
| 2022 | 0.7 |
| 2021 | 0.6 |
| 2020 | 0.7 |
| 2019 | 0.7 |
| 2018 | 0.6 |
| 2017 | 0.7 |
| 2016 | 0.6 |
| 2015 | 0.6 |
| 2014 | 0.7 |
| 2013 | 0.6 |
| 2012 | 0.8 |
| 2011 | 0.8 |
| 2010 | 0.9 |
| 2009 | 0.9 |
| 2008 | 0.9 |
| 2007 | 1.1 |
| 2006 | 1.1 |
| 2005 | 1.2 |
| 2004 | 1.2 |
| 2003 | 1.4 |
| 2002 | 1.4 |
| 2001 | 1.4 |
| 2000 | 1.3 |