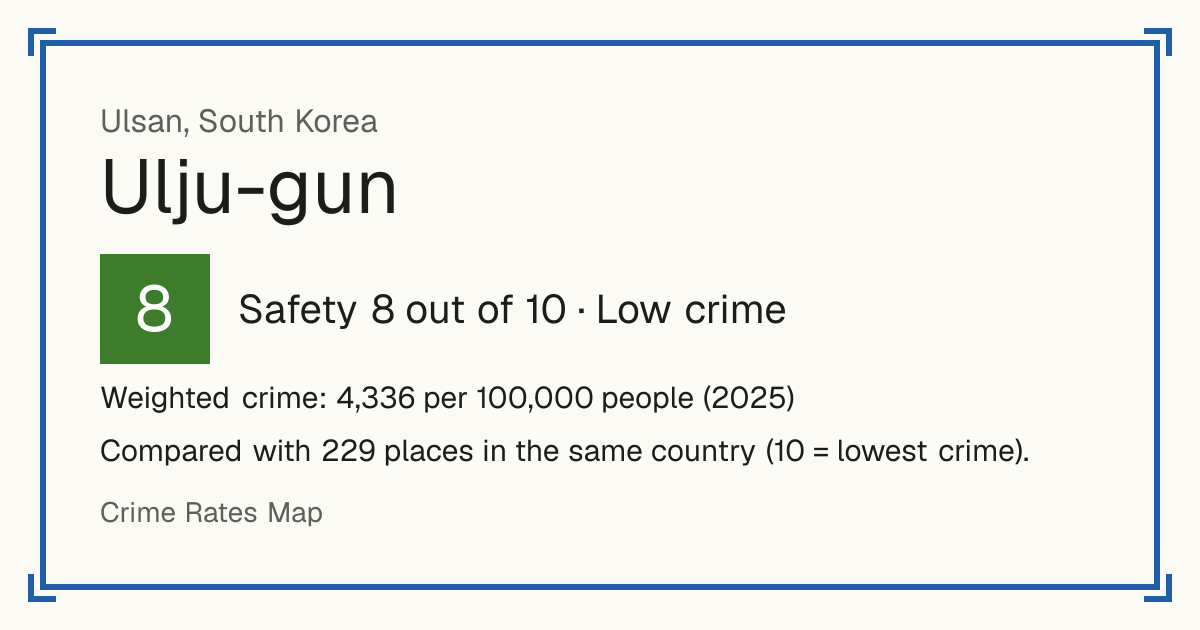
8Ulju-gun
Ulju-gun, South Korea: crime rate and Safety score
Safety 8 out of 10 Low crime
8/10 in South Korea · 10/10 in the world
Compared with 229 places in the same country (10 = lowest crime).
Weighted crime: 4,336 per 100,000 people (2025)
Crime by type, as recorded by Korean National Police Agency (2025)
| Type | Count | Per 100,000 a year | All places this source covers |
|---|---|---|---|
| Homicide | |||
| Murder | 0 | 0 | 0.5 |
| Attempted murder and related offences | 3 | 1.4 | 0.8 |
| Attempts, plus preparing or conspiring to murder: no one died. | |||
| Sexual offences | |||
| Rape | 11 | 5 | 9.9 |
| Sexual assault by penetration | 1 | 0.5 | 1.7 |
| Indecent assault | 51 | 23.3 | 30 |
| Other rape and sexual assault | 0 | 0 | 0.3 |
| Violence | |||
| Assault causing injury | 85 | 38.8 | 32.8 |
| Assault | 343 | 156.5 | 218.9 |
| False imprisonment | 2 | 0.9 | 1.8 |
| Threats | 74 | 33.8 | 50.3 |
| Abduction | 0 | 0 | 0.8 |
| Group or armed violence | 23 | 10.5 | 9.8 |
| Robbery | |||
| Robbery | 3 | 1.4 | 0.9 |
| Extortion | 9 | 4.1 | 8.2 |
| Theft and burglary | |||
| Theft | 417 | 190.3 | 330.6 |
| Drugs | |||
| Drug offences | 25 | 11.4 | 22.1 |
| Damage and public order | |||
| Arson | 1 | 0.5 | 1.8 |
| Criminal damage | 153 | 69.8 | 83.3 |
| Other | |||
| Fraud | 1,540 | 702.6 | 826 |
Source: Korean National Police Agency, updated 28 October 2026.
Recorded crime by type (2025)
| Homicide | 3 |
|---|---|
| Sexual offences | 63 |
| Violence | 527 |
| Robbery | 12 |
| Theft and burglary | 417 |
| Drugs | 25 |
| Damage and public order | 154 |
| Other | 1,540 |
Questions about crime in Ulju-gun
- Is Ulju-gun safe?
- Ulju-gun: Safety 8 out of 10 (Low crime). Compared with 229 places in the same country (10 = lowest crime).
- What is the crime rate in Ulju-gun?
- Ulju-gun: Weighted crime: 4,336 per 100,000 people (2025).
- How many murders are there in Ulju-gun?
- Recorded homicides in Ulju-gun (2025): 3.