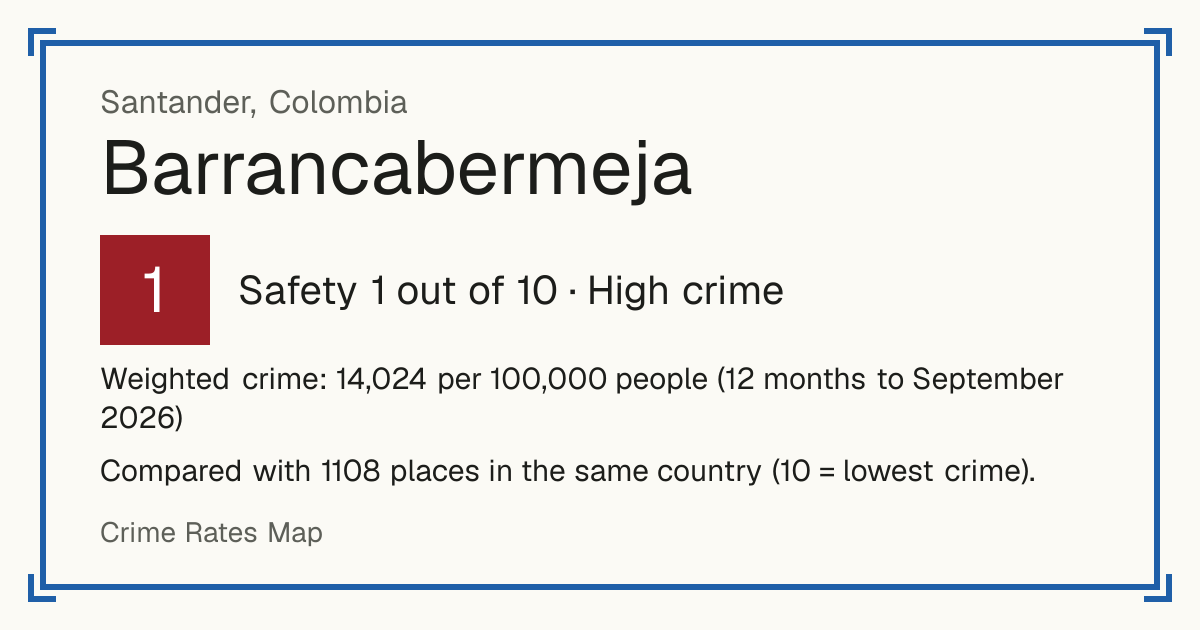
1Barrancabermeja
Barrancabermeja, Colombia: crime rate and Safety score
Safety 1 out of 10 High crime
1/10 in Colombia · 1/10 in the world
Compared with 1108 places in the same country (10 = lowest crime).
Weighted crime: 14,024 per 100,000 people (12 months to September 2026)
Crime by type, as recorded by MinDefensa / Policía Nacional (12 months to September 2026)
| Type | Count | Per 100,000 a year | All places this source covers |
|---|---|---|---|
| Homicide | |||
| Homicide | 122 | 55.5 | 26.3 |
| Counted in victims, not cases; femicides included. | |||
| Sexual offences | |||
| Sexual offences | 153 | 69.6 | 59 |
| Violence | |||
| Assault causing injury | 449 | 204.3 | 181.5 |
| Domestic violence | 757 | 344.4 | 284.7 |
| Kidnapping | 0 | 0 | 0.9 |
| Robbery | |||
| Extortion | 110 | 50 | 25.7 |
| Cargo and vehicle hijacking | 0 | 0 | 0.1 |
| Theft and burglary | |||
| Theft and robbery from people | 676 | 307.6 | 518.3 |
| Colombian law counts thefts and robberies together as hurto, so street robbery is in this line. | |||
| Home burglary | 147 | 66.9 | 47.3 |
| Theft from shops and businesses | 142 | 64.6 | 41.7 |
| Car and motorbike theft | 145 | 66 | 79.3 |
| Theft from banks | 0 | 0 | 0 |
| Livestock theft | 5 | 2.3 | 1 |
| Other | |||
| Computer crime | 395 | 179.7 | 170.9 |
Source: MinDefensa / Policía Nacional, updated 26 October 2026.
Recorded crime by type (12 months to September 2026)
| Homicide | 122 |
|---|---|
| Sexual offences | 153 |
| Violence | 1,206 |
| Robbery | 110 |
| Theft and burglary | 1,115 |
| Other | 395 |