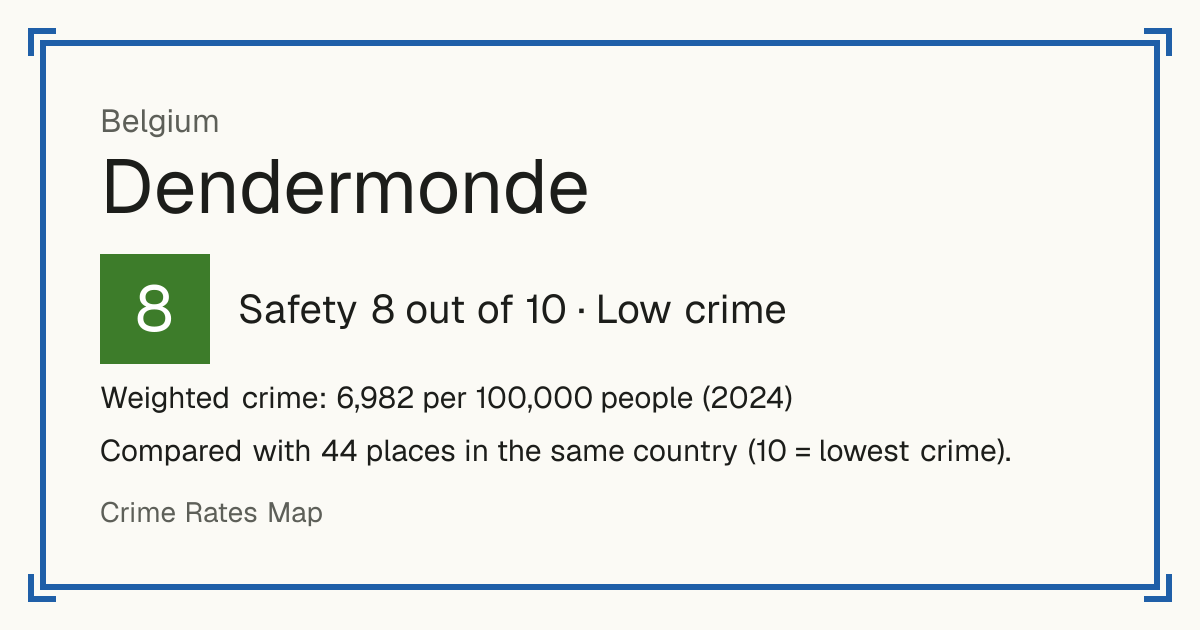
8Dendermonde
Dendermonde, Belgium: crime rate and Safety score
Safety 8 out of 10 Low crime
8/10 in Belgium · 8/10 in the world
Compared with 44 places in the same country (10 = lowest crime).
Weighted crime: 6,982 per 100,000 people (2024)
Crime by type, as recorded by Eurostat / national police (2024)
| Type | Count | Per 100,000 a year | All places this source covers |
|---|---|---|---|
| Homicide | |||
| Intentional homicide | 2 | 1 | 1.8 |
| Violence | |||
| Assault | 912 | 439 | 416.4 |
| Robbery | |||
| Robbery | 73 | 35.1 | 24 |
| Theft and burglary | |||
| Burglary of homes | 400 | 192.6 | 67.4 |
| Other burglary | 151 | 72.7 | 78.8 |
| Motor vehicle theft | 43 | 20.7 | 20.3 |
| Other theft | 1,706 | 821.2 | 322.3 |
Source: Eurostat / national police, updated 29 October 2026.
Recorded crime by type (2024)
| Homicide | 2 |
|---|---|
| Violence | 912 |
| Robbery | 73 |
| Theft and burglary | 2,300 |
Questions about crime in Dendermonde
- Is Dendermonde safe?
- Dendermonde: Safety 8 out of 10 (Low crime). Compared with 44 places in the same country (10 = lowest crime).
- What is the crime rate in Dendermonde?
- Dendermonde: Weighted crime: 6,982 per 100,000 people (2024).
- How many murders are there in Dendermonde?
- Recorded homicides in Dendermonde (2024): 2.
- Which areas of Dendermonde have the least crime?
- Lowest crime among the 10 municipalities of Dendermonde with a Safety score: Lebbeke (8/10), Laarne (7/10), Wichelen (6/10). Highest crime among the 10 municipalities of Dendermonde with a Safety score: Berlare (2/10), Dendermonde (2/10), Zele (2/10).
Living
7/10 Living 7 out of 10: the average of the places in it, on their scale.
Raw score 7.8 out of 10, before ranking.
Places in Dendermonde
- Berlare 2/10
- Buggenhout 5/10
- Dendermonde 2/10
- Hamme 4/10
- Laarne 7/10
- Lebbeke 8/10
- Waasmunster 4/10
- Wetteren 2/10
- Wichelen 6/10
- Zele 2/10