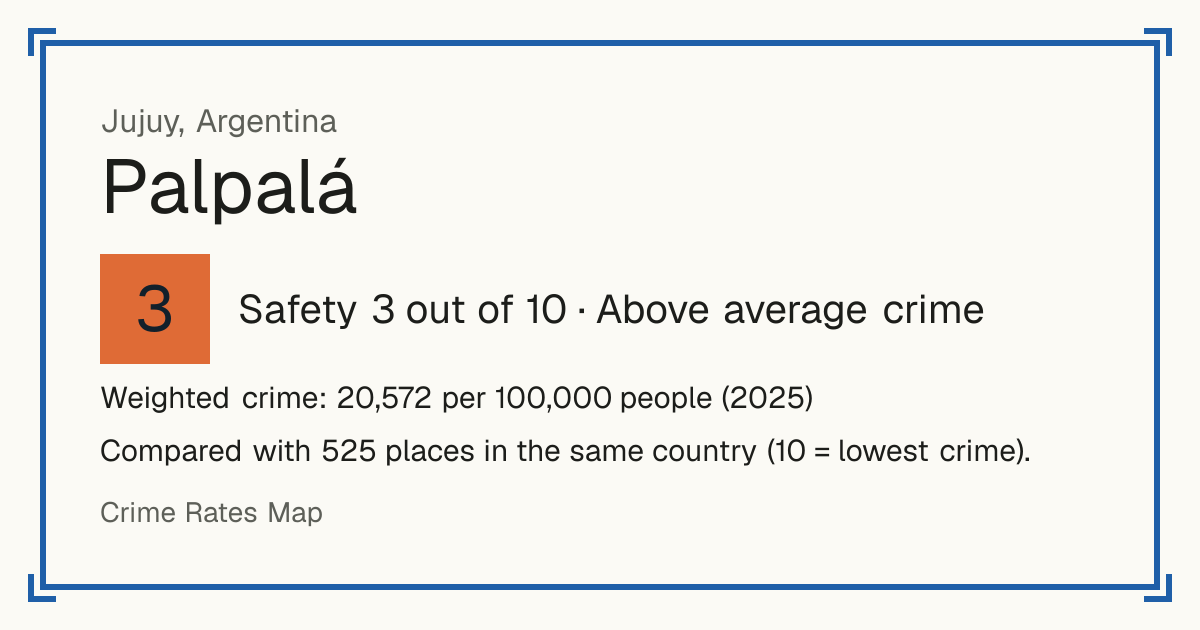
3Palpalá
Palpalá, Argentina: crime rate and Safety score
Safety 3 out of 10 Above average crime
3/10 in Argentina · 3/10 in the world
Compared with 525 places in the same country (10 = lowest crime).
Weighted crime: 20,572 per 100,000 people (2025)
Crime by type, as recorded by Ministerio de Seguridad (SNIC) (2025)
| Type | Count | Per 100,000 a year | All places this source covers |
|---|---|---|---|
| Homicide | |||
| Homicide | 0 | 0 | 3.5 |
| Completed homicides only: attempts are counted on their own line. | |||
| Sexual offences | |||
| Rape | 10 | 15.3 | 14.3 |
| Includes attempts. | |||
| Sexual abuse | 42 | 64.1 | 44.8 |
| Other sexual offences | 26 | 39.7 | 13.6 |
| Includes online sexual offences against children. | |||
| Violence | |||
| Attempted homicide | 0 | 0 | 3.2 |
| Attempts only. | |||
| Assault causing injury | 323 | 493 | 392.6 |
| Threats | 277 | 422.8 | 476.6 |
| Kidnapping for ransom | 0 | 0 | 0.2 |
| Robbery | |||
| Robbery | 440 | 671.5 | 809.3 |
| Robo: theft with force or violence, including robberies that caused injury or death. | |||
| Attempted robbery | 65 | 99.2 | 66.7 |
| Attempts only. | |||
| Extortion | 6 | 9.2 | 4.4 |
| Theft and burglary | |||
| Theft | 605 | 923.4 | 676 |
| Hurto: theft without force or violence. | |||
| Attempted theft | 92 | 140.4 | 38.9 |
| Attempts only. | |||
| Drugs | |||
| Drug supply and production | 21 | 32.1 | 37.2 |
| Drug possession | 27 | 41.2 | 178.4 |
| Includes possession for personal use and other drug law offences. | |||
| Damage and public order | |||
| Criminal damage | 92 | 140.4 | 176.7 |
| Public order offences | 0 | 0 | 3.8 |
| Other | |||
| Fraud | 249 | 380 | 235.9 |
| In person and online. | |||
Source: Ministerio de Seguridad (SNIC), updated 26 October 2026.
Recorded crime by type (2025)
| Homicide | 0 |
|---|---|
| Sexual offences | 78 |
| Violence | 600 |
| Robbery | 511 |
| Theft and burglary | 697 |
| Drugs | 48 |
| Damage and public order | 92 |
| Other | 249 |
Other places nearby
- El Carmen 3/10
- San Pedro 4/10
- Dr. Manuel Belgrano 2/10
- San Antonio 9/10
- Ledesma 3/10
- Tilcara 3/10
- Santa Bárbara 5/10
- Tumbaya 5/10