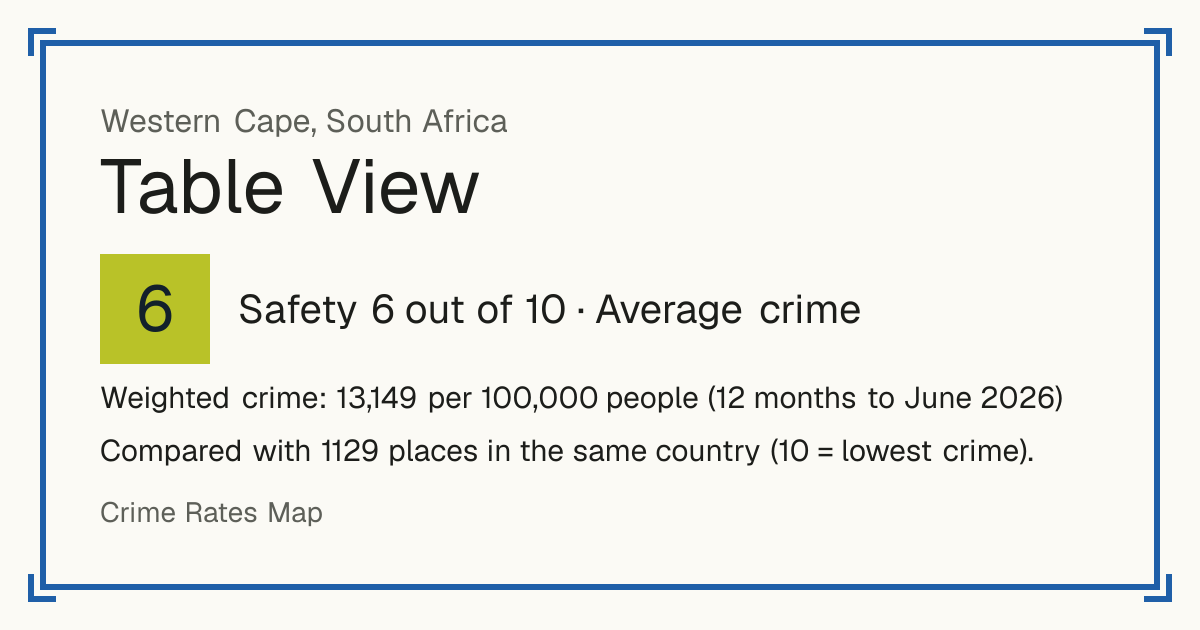
6Table View
Table View, South Africa: crime rate and Safety score
Safety 6 out of 10 Average crime
6/10 in South Africa · 1/10 in the world
Compared with 1129 places in the same country (10 = lowest crime).
Weighted crime: 13,149 per 100,000 people (12 months to June 2026)
Residents: about 178,562, a WorldPop 2025 modelled estimate summed within the police precinct, not a census count.
Crime by type, as recorded by SAPS (12 months to June 2026)
| Type | Count | Per 100,000 a year | All places this source covers |
|---|---|---|---|
| Homicide | |||
| Murder | 34 | 19 | 34.6 |
| Sexual offences | |||
| Rape | 65 | 36.4 | 61.8 |
| Sexual assault | 19 | 10.6 | 11.6 |
| Attempted sexual offences | 3 | 1.7 | 4 |
| Other contact sexual offences | 1 | 0.6 | 1.2 |
| Violence | |||
| Attempted murder | 35 | 19.6 | 44.5 |
| Assault with intent to cause serious harm | 137 | 76.7 | 265.1 |
| Common assault | 520 | 291.2 | 291.2 |
| Kidnapping | 15 | 8.4 | 28.7 |
| Abduction of a minor | 0 | 0 | 0.2 |
| Robbery | |||
| Armed or aggravated robbery | 288 | 161.3 | 178.3 |
| Includes carjacking, house and business robbery and cash-in-transit heists. | |||
| Common robbery | 257 | 143.9 | 67.4 |
| Theft and burglary | |||
| Home burglary | 386 | 216.2 | 193.2 |
| Burglary of other premises | 10 | 5.6 | 66.4 |
| Livestock theft | 0 | 0 | 33.5 |
| Shoplifting | 184 | 103 | 59.8 |
| Vehicle theft | 63 | 35.3 | 45.2 |
| Theft from vehicles | 530 | 296.8 | 112.4 |
| Other theft | 1,076 | 602.6 | 354.3 |
| Drugs | |||
| Drug offences | 521 | 291.8 | 357.5 |
| Found through police action, so it rises with policing. | |||
| Damage and public order | |||
| Public violence | 2 | 1.1 | 1.6 |
| Arson | 9 | 5 | 4.1 |
| Malicious damage to property | 212 | 118.7 | 160.3 |
| Other | |||
| Culpable homicide | 6 | 3.4 | 15.2 |
| Unlawful killing without intent, mostly on the roads. | |||
| Driving under the influence | 94 | 52.6 | 133.3 |
| Found through police action, so it rises with policing. | |||
| Illegal firearms and ammunition | 6 | 3.4 | 24.2 |
| Sexual offences found by police action | 0 | 0 | 20.3 |
| Mainly sex work offences, not attacks on a person. | |||
| Child neglect and ill-treatment | 1 | 0.6 | 3.6 |
| Crimen injuria (serious insult) | 40 | 22.4 | 40.7 |
| Fraud and commercial crime | 980 | 548.8 | 228.2 |
Source: SAPS, updated 29 October 2026.
Recorded crime by type (12 months to June 2026)
| Homicide | 34 |
|---|---|
| Sexual offences | 88 |
| Violence | 707 |
| Robbery | 545 |
| Theft and burglary | 2,249 |
| Drugs | 521 |
| Damage and public order | 223 |
| Other | 1,127 |
Questions about crime in Table View
- Is Table View safe?
- Table View: Safety 6 out of 10 (Average crime). Compared with 1129 places in the same country (10 = lowest crime).
- What is the crime rate in Table View?
- Table View: Weighted crime: 13,149 per 100,000 people (12 months to June 2026).
- How many murders are there in Table View?
- Recorded homicides in Table View (12 months to June 2026): 34.